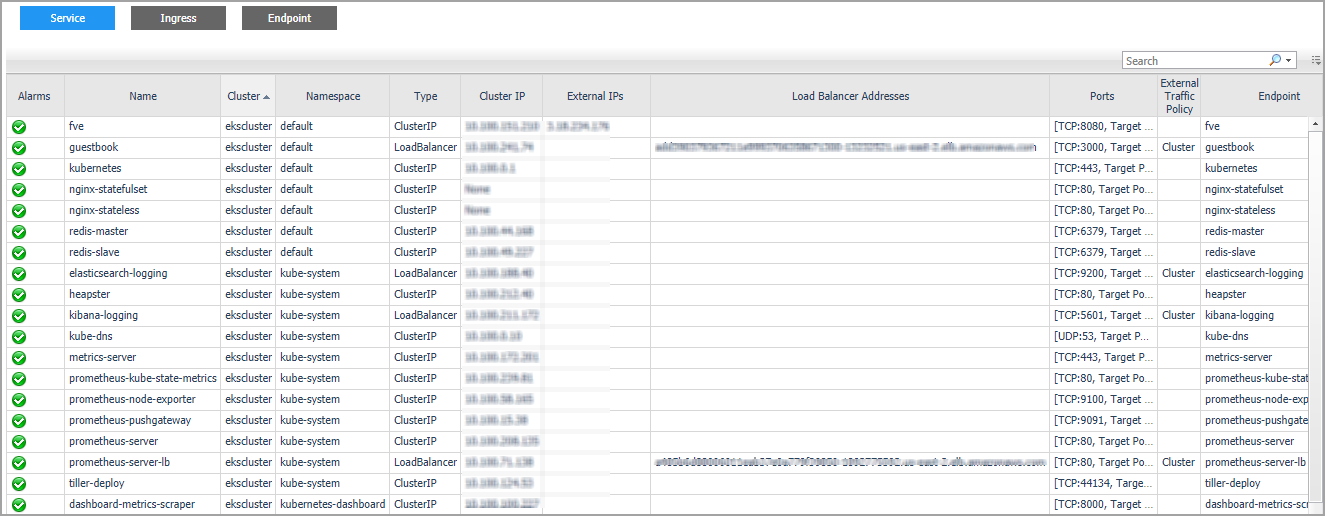
The Load Balancer dashboard includes information about Kubernetes service, endpoint, and ingress. A Kubernetes ingress can provide load balancing, SSL termination, and name-based virtual hosting. A Kubernetes service is an abstraction which defines a logical set of pods and a policy by which to access them - sometime called micro-services. Kubernetes will update the endpoint whenever the set of pods in a service changes.
The Alarms dashboard displays a list of alarms generated against the monitored Kubernetes environment. Use this view to quickly identify any potential problems related to a specific Kubernetes component.
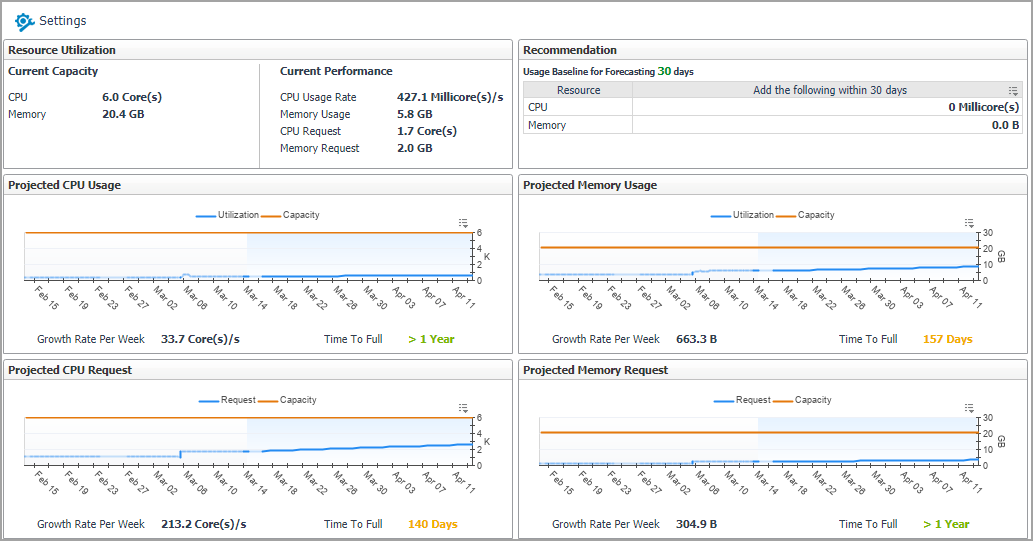
The Capacity Management dashboard contains the following fields:
|
• |
|
|
• |
Baseline for Forecasting: Defines the historical period used for the calculations of metric views, current capacity, and recommended resources in the Resource Utilization view. The default value is 60 Days Trending. |
|
• |
Time Frame: Defines the predicted period for calculating metric views, current capacity, and recommended resources in the Resource Utilization view. The default value is Next 30 Days. |
|
• |
Current Capacity: current resource capacity. |
|
• |
Current Performance: current resource usage. |
|
• |
Projected CPU/Memory Usage: Shows the historical data and the predicted usage trend within the configured future period. |
|
• |
Projected CPU/Memory Request: Shows the historical data and the predicted request trend within the configured future period. |
|
• |
Utilization: usage. |
|
• |
Capacity: upper bound which the usage might reach. |
|
• |
Growth Rate per Week: growth amount of the resource. |
|
• |
Time to Full: how many days the resource usage/request will reach the capacity. |
|
NOTE: If a value Never is displayed at Time to Full, which means the usage/request trend is declining and the usage/request will never reach the capacity. |
Foglight for Container Management provide cost management feature for Kubernetes. The Cost view appears after clicking Container > Kubernetes > Cost. Currently, the Kubernetes costs for AKS and EKS environment are calculated.
To use the cost data, ensure the following:
|
NOTE: Cost metrics should be configured for cloud agents to collect cost data. Refer to the Cost Tab section in Foglight Hybrid Cloud Manager User and Administration Guide for detailed information. |
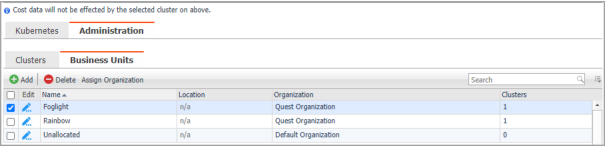
Administration dashboard enables you to manage the relationships between your cluster and BU, configure budgets at cluster level, and view summarized information about cluster, BU, and cost.
Business Units tab enables you to manage your BU for your Organizations. You can create different BUs to manage your clusters.
The Business Units tab displays the following information:
|
• |
Name: BU name. |
|
• |
Location: Geographic location of the BU. |
|
• |
Organization: Organization of this BU. |
|
• |
Clusters: numbers of the Kubernetes clusters that have been assigned to this BU. |
The Clusters tab displays the following information:
|
• |
Name: The name of the Kubernetes cluster. |
|
• |
Business Unit: The name of the BU. |
|
• |
Platform: AKS, EKS, or On-Prem. If Container cost failed to detect the AKS or ESK cluster, it will display On-Prem by default. |
|
• |
Spending: The trend of cost spending. |
|
• |
Monthly Budget: Monthly budget, which can be configured through Set Budget. |
|
• |
Last Month (Month.Year): The cost of last month. |
|
• |
Month-to-Date (Month.Year): The cost of current month. |
|
• |
Forecast (Month.Year): The cost prediction for next month. |
|
• |
Last Collected Date: The latest date till when the cost data is collected. It depends on the Last collected time from different platforms. |
|
• |
Set Budget: Set monthly budget for the cluster |
|
• |
Assign Business Unit: Assign the cluster to a specific BU. |
|
• |
Remove from Business Unit: Remove the cluster from the selected BU. |
|
• |
Assign AWS Account: This button will be enabled for editing only when an EKS cluster is selected. |
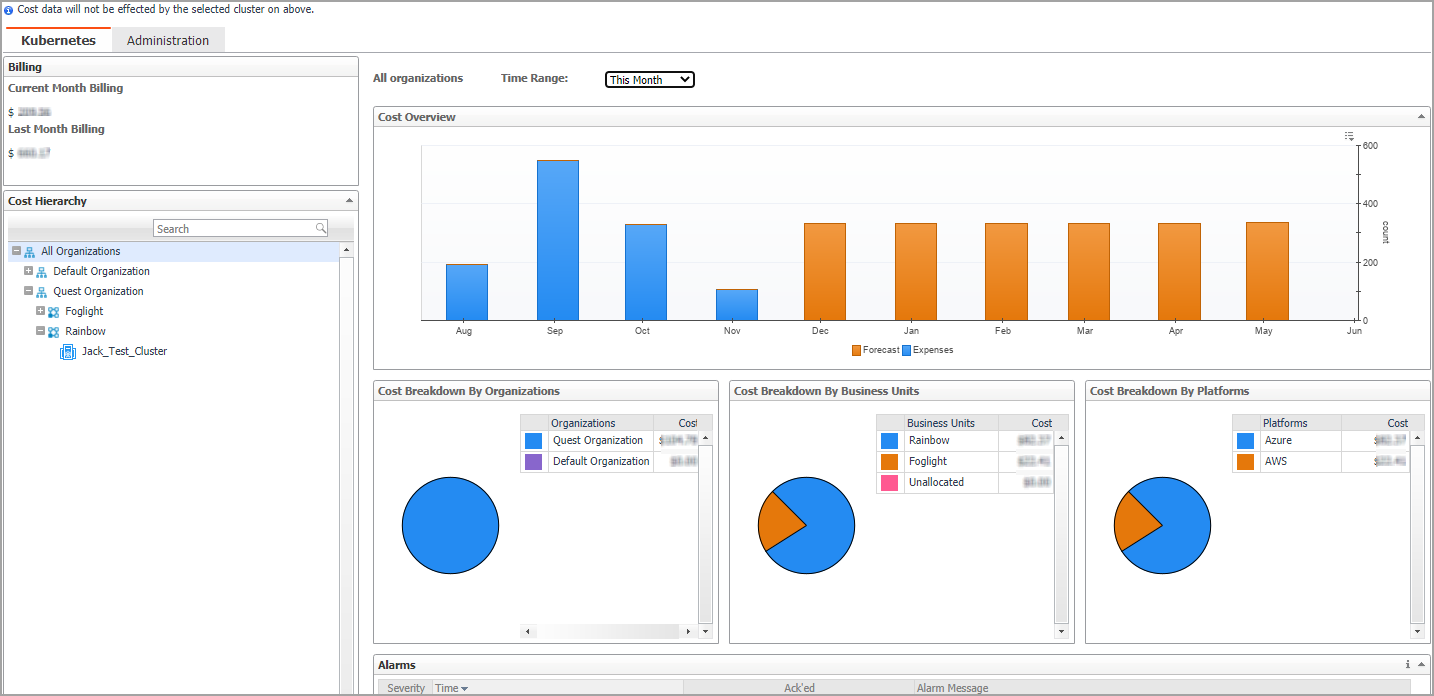
The Kubernetes dashboard displays a Cost Overview and several cost breakdown charts. The cost breakdown charts vary when choosing All Organizations, a single organization, a single BU, or a single cluster.
The Kubernetes overview shows the following information:
|
• |
Time Range: Enables you to change the time range for displaying the cost, including This Month, Last Month, or Last N months. |
|
• |
Cost Overview: Monthly cost aggregated from all the clusters and the forecast aggregated cost for the continuing months. |
|
• |
Cost Breakdown By Organizations: Cost categories by different organizations. Displayed when choosing All Organization. |
|
• |
Cost Breakdown By Business Units: Cost categories by different BUs cross Organizations. Displayed when choosing All Organization or an organization. |
|
• |
Cost Breakdown by Platforms: Cost categories by different platforms, such as AKS, EKS, and so on. |
|
• |
Most Expensive Clusters: Displays the top N clusters that costs the most. Displayed when choosing an organization. |
|
• |
Clusters Cost: Cost of the clusters of this BU. Displayed when choosing a BU. |
|
• |
Alarms: all the cluster cost alarms. Currently we have over-budget alarm. |
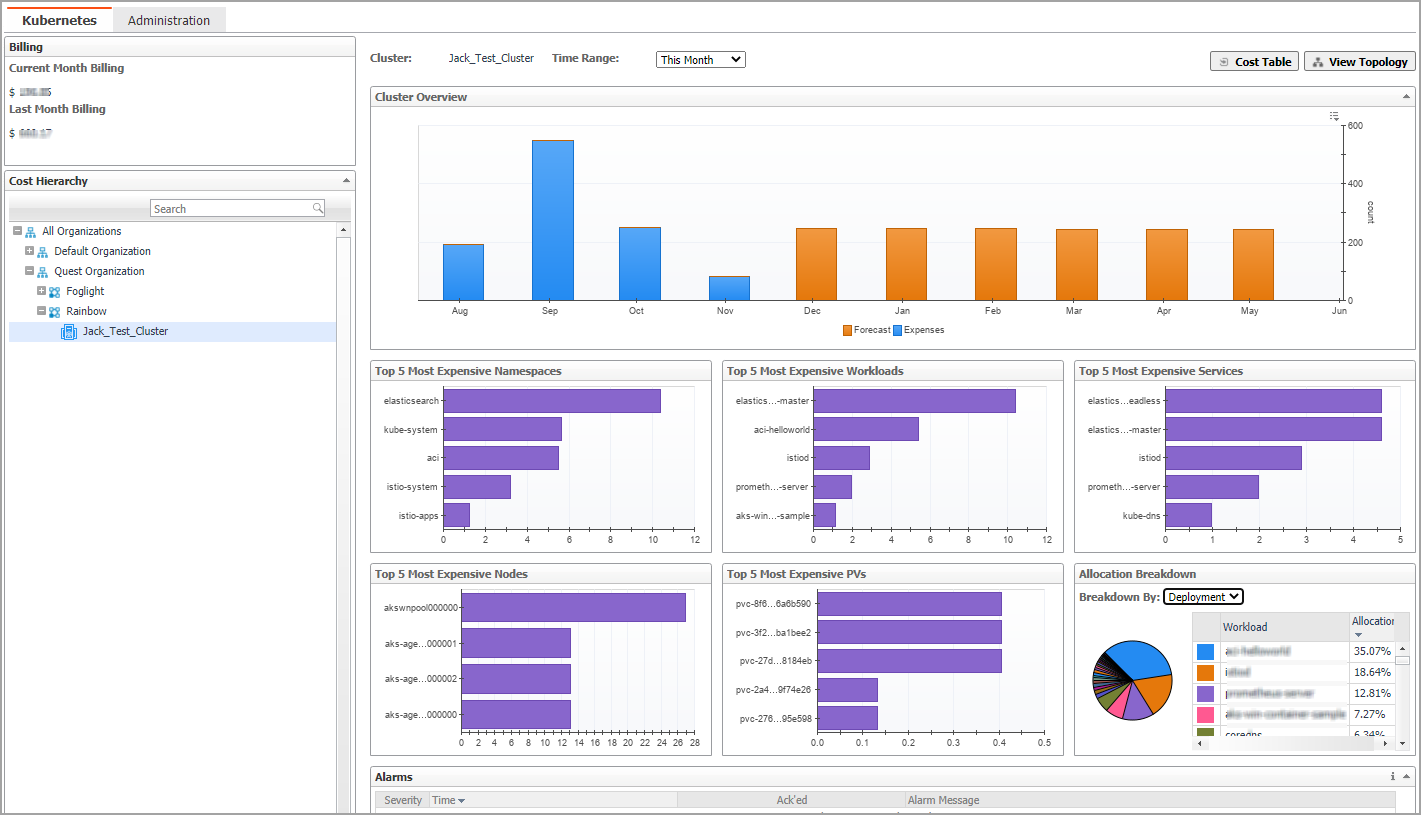
The Cluster overview dashboard shows the following information:
|
• |
Time Range: Enables you to change the time range for displaying the cost, including This Month, Last Month, or Last N months. |
|
• |
Cluster Overview: The monthly cost aggregated from all the clusters of the organization and the forecast aggregated cost for the continuing months. |
|
• |
Top 5 Most Expensive Namespaces: Displays the top 5 most expensive namespaces whose cost is aggregated from its workloads. |
|
• |
Top 5 Most Expensive Workloads: Displays the top 5 most expensive workloads whose cost is aggregated from its related pods. |
|
• |
Top 5 Most Expensive Services: Displays the top 5 most expensive services whose cost is aggregated from its related pods. |
|
• |
Top 5 Most Expensive Nodes: Displays the top 5 most expensive nodes whose cost is collected from Azure or AWS. |
|
• |
Top 5 Most Expensive PVs: Displays the top 5 most expensive persistent volumes whose cost is collected from Azure or AWS. |
|
• |
Allocation Breakdown: Displays the Allocation Breakdown cost by Deployment or Stateful Set. |
|
• |
Alarms: Displays all the cluster cost over-budget alarms. |
|
• |
|
• |
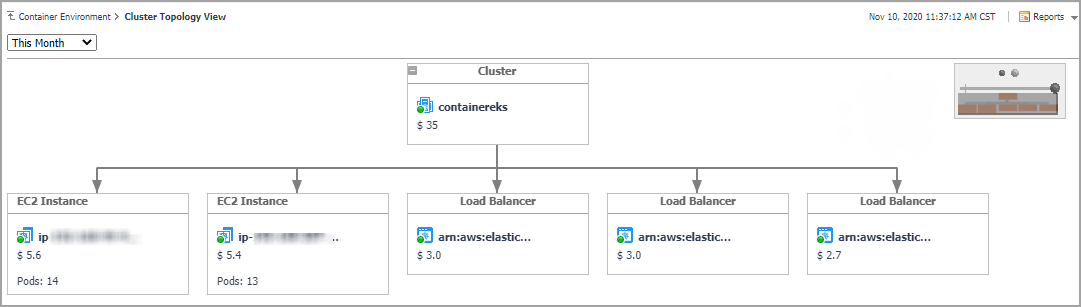
View Topology button: Clicking the button will navigate to a Cluster Topology View. |
Click View Topology button to open the Cluster Topology View.