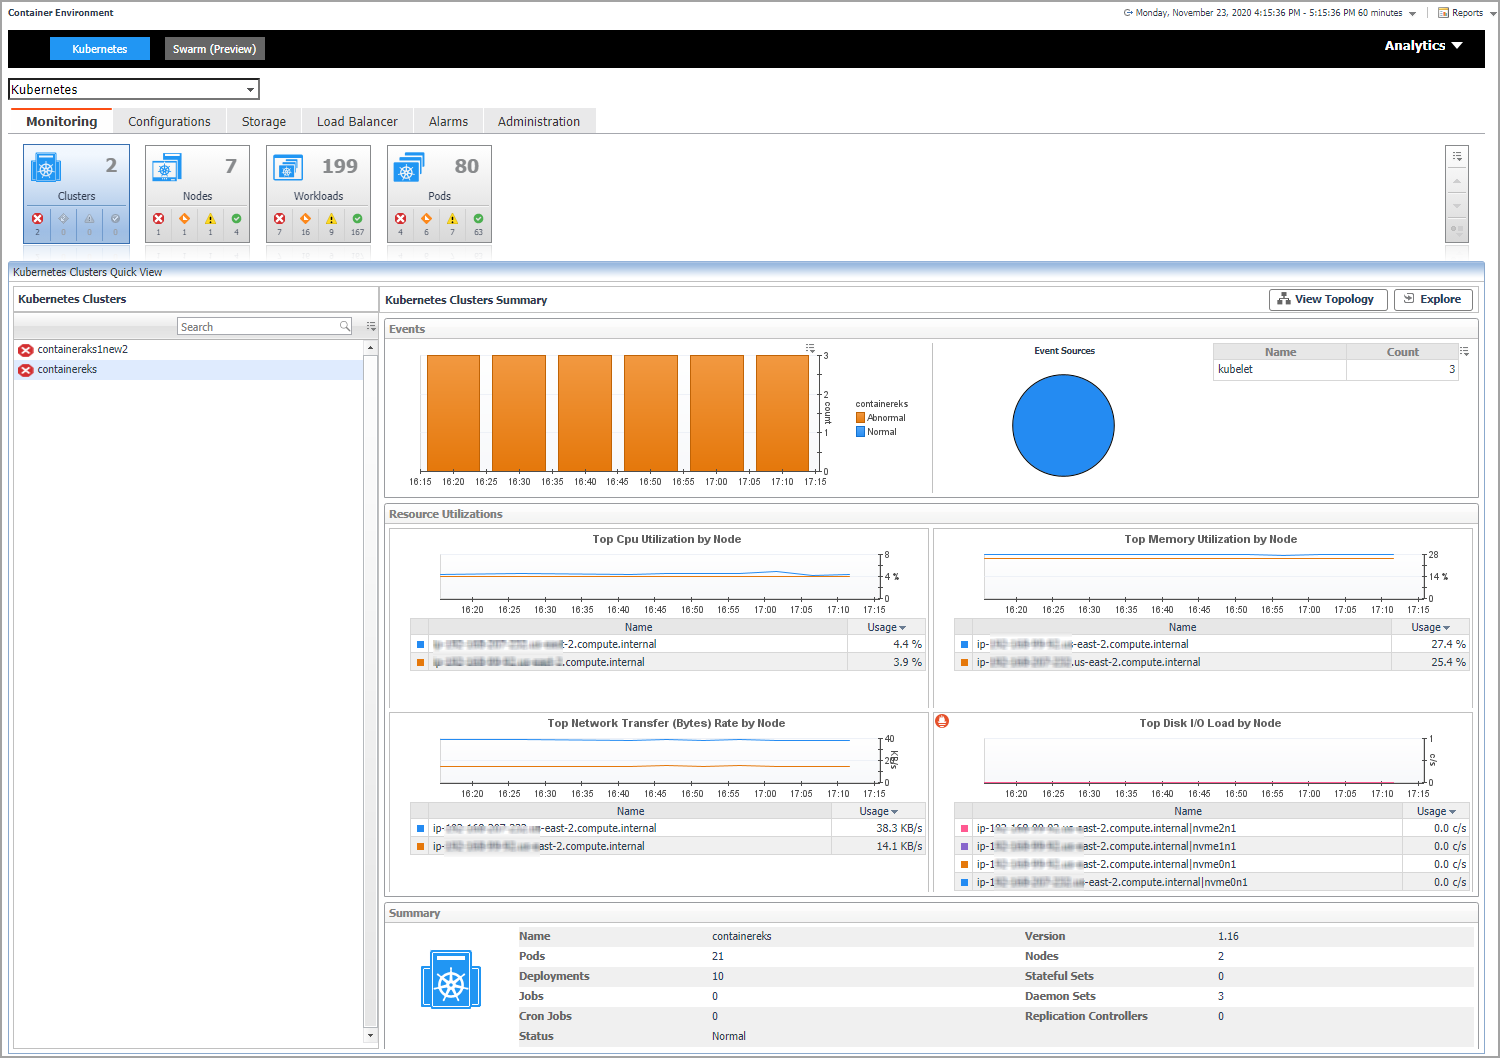
Kubernetes cluster is a group of kubernetes resources. There are two kinds of nodes inside a cluster, Kubernetes master and Kubernetes nodes. Kubernetes master is responsible for maintaining the desired state of your cluster which Kubernetes node is responsible to run your application and cloud workflows.The Kubernetes Cluster Quick View, which appears after clicking Monitoring > Clusters, shows the data collected about the selected clusters and namespaces. This view consists of the following two panes:
|
• |
The Kubernetes Clusters tree view, which appears on the left of Kubernetes Clusters Quick View, lists the clusters existing in the monitored Kubernetes environment. |
|
• |
The Kubernetes Clusters Summary view, which appears on the right after you select an individual cluster in the Kubernetes Clusters tree view. |
The Kubernetes Clusters Summary view appears on the right when you select a node in the Kubernetes Clusters tree view.
The Kubernetes Clusters Summary view displays the following data:
|
• |
Events: The events occur on the selected Kubernetes cluster over a selected period of time, which includes: |
|
• |
|
• |
Resource Utilizations: The resource utilization for the selected Kubernetes cluster over a selected period of time, which includes the following: |
|
• |
Top CPU Utilization by Node: shows the nodes that CPU Utilization are top N highest. |
|
• |
Top Memory Utilization by Node: shows the nodes that Memory Utilization are top N highest. |
|
• |
Top Network Transfer (Bytes) Rate by Node: shows the nodes that Network Transfer (Bytes) Rate are top N highest. |
|
• |
Top Disk I/O Load by Node: shows the nodes that Disk I/O Load are top N highest. |
|
• |
|
|
• |
Summary: Displays the detailed information about the selected Kubernetes cluster, including Name, Version, Pods, Nodes, Deployments, Stateful Sets, Jobs, and Replica Sets. |
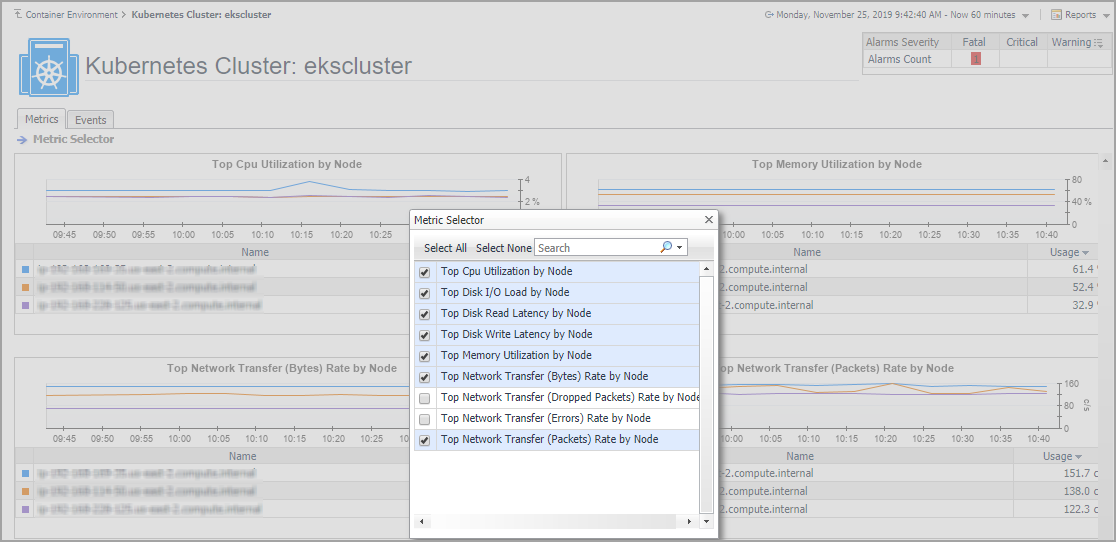
Click Explore on the upper right of the Kubernetes Clusters Summary view to open the Cluster Explorer view, which shows more detailed information about this Kubernetes cluster.
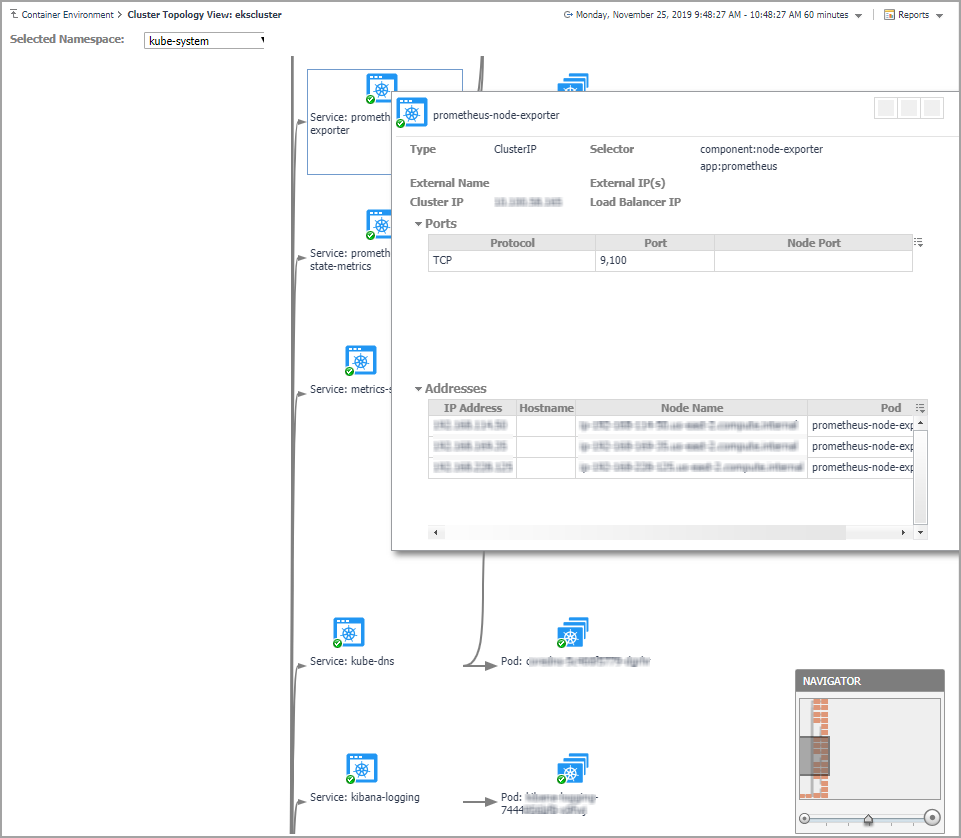
Click View Topology on the upper right of the Kubernetes Clusters Summary view to open the Cluster Topology view, which shows the topology graph from the application accessible aspect.
The Cluster Explorer view opens when you click Explore in the Kubernetes Clusters Summary view, which includes the following tabs:
|
• |
Metrics tab: The Metrics tab displays a Metric Selector allowing you to choose the metrics to be plotted on this dashboard. Charts of CPU Usage and Memory Usage are presented by default. |
|
• |
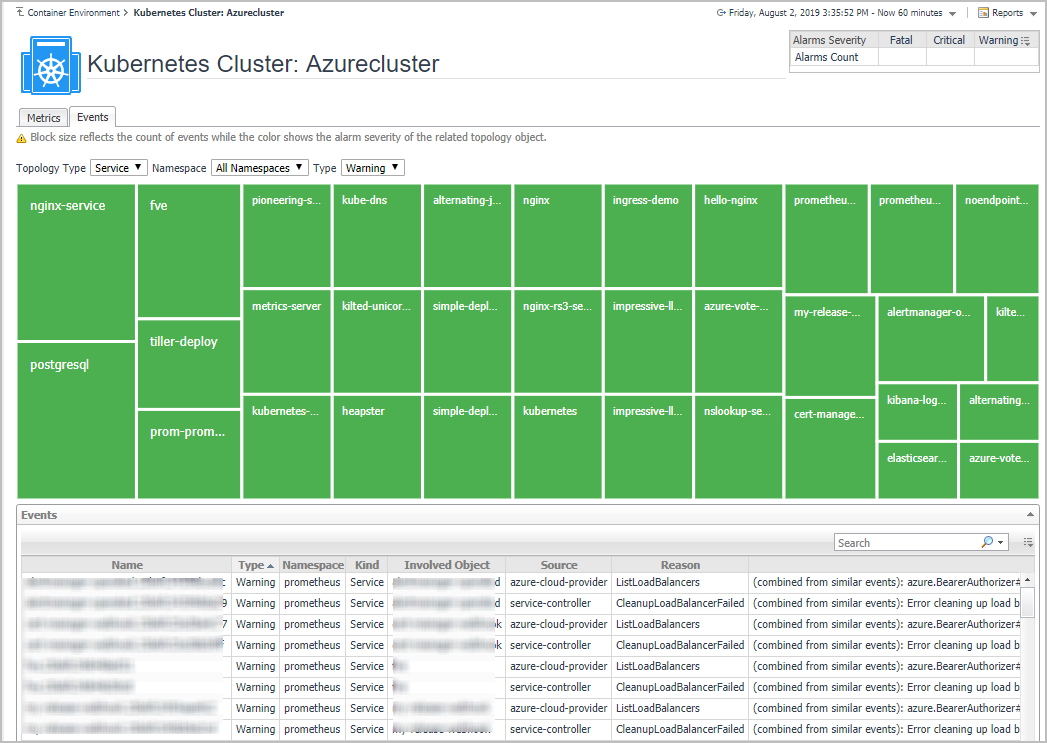
Events tab: The Events tab shows a Heat Map of the events occur in this cluster. Heat maps will be refreshed automatically when you change either of the following fields: |
|
• |
Topology Type: Indicates the Kubernetes components on which the event occurs, including Pod, Node, and Service. |
|
• |
Namespace: Use the namespaces to filter the events. |
|
• |
Type: Indicates the severity of the event, including warning and normal. |
The topology view visualizes the relationships between the objects from the pods accessible aspect in your environment through an interactive dependency map. The map illustrates how different components relate to each other, and the levels of the available resources available to them. Click on Pod, another sub topology view will popup to show the relationship from pods controller to storage for the selected Pod. Click other components or click the Pod inside the sub topology view, an information view will popup to show alarms, basic information, some metrics. From the information popup view of Pod, Node, and Cluster, click the Explore button will navigate to the explorer view of the selected Pod/Node/Cluster.
The NAVIGATOR in the bottom-right corner allows you to easily set the zoom level by dragging the slider into the appropriate position.
A node, previously known as a minion, is a worker machine in Kubernetes. A node may be a VM or physical machine, depending on the cluster. Each node has the services necessary to run pods and is managed by the master components. The Kubernetes Nodes Quick View, which appears after clicking Monitoring > Nodes, shows the data collected about the selected clusters and namespaces. This view consists of the following two panes:
|
• |
The Kubernetes Nodes tree view, which appears on the left of Kubernetes Nodes Quick View, lists the nodes existing in the monitored Kubernetes environment. |
|
• |
The Kubernetes Nodes Summary view, which appears on the right after you select an individual node in the Kubernetes Nodes tree view. |