Chat now with support
Chat mit Support

Foglight for VMware Horizon View 6.0.0 - User Guide

Manage desktops in virtual environments Interact with Foglight for VMware Horizon View dashboards Reference

Foglight browser interface elements

Depending on your user roles, you may see either the contents of the first bookmark (the Welcome page is the default) listed under Bookmarks, or a home page. For further details about roles, see the Foglight User Guide.

Typically, the browser interface is divided into three panels: the navigation panel on the left, the display area in the middle, and the action panel on the right.

The navigation panel operates like a drawer. Its default state is open. To close the navigation panel, click the arrow at the far left of the Foglight for Hyper-V browser interface. Click that arrow again to open the navigation panel.

The navigation panel lists all of the dashboards that are available to the current user for viewing. You can use the navigation panel to select a dashboard to view in the display area. To access a specific dashboard, open the appropriate module (VMware View, for example).

The navigation panel also provides access to the Foglight for Hyper-V Administration and Configuration areas.

If you do not see any dashboards in the navigation panel, the user ID with which you signed in may not have been assigned to a group. For details, see the Foglight User Guide.

The display area is used to view current dashboards and reports, as well as to create new dashboards and reports. You can increase the size of this area by resizing the navigation panel, or, if the action panel is open, by closing the action panel.

Figure 2. Display area

The action panel operates like a drawer. Its default state is closed. To open the action panel, click the arrow at the far right of the Foglight for Hyper-V browser interface. Click that arrow again to close the action panel.

The action panel contains the various actions and tasks you can perform with the current dashboard. It also contains views and data that you can add to a dashboard or report you are creating and provides access to the online help files.

Breadcrumbs

If you drill down into various levels across dashboards, a trail of breadcrumbs is left at the top of the current dashboard. This trail provides you with context. It also provides you with the name of the level you are currently viewing and with a simple mechanism for returning to any of its related parent levels.

The following breadcrumb trail was created while drilling down from the VMware View Environment dashboard into the VMware Explorer dashboard. Each item within a breadcrumb trail is a hyper link to a previously viewed parent level.

Figure 3. Breadcrumbs

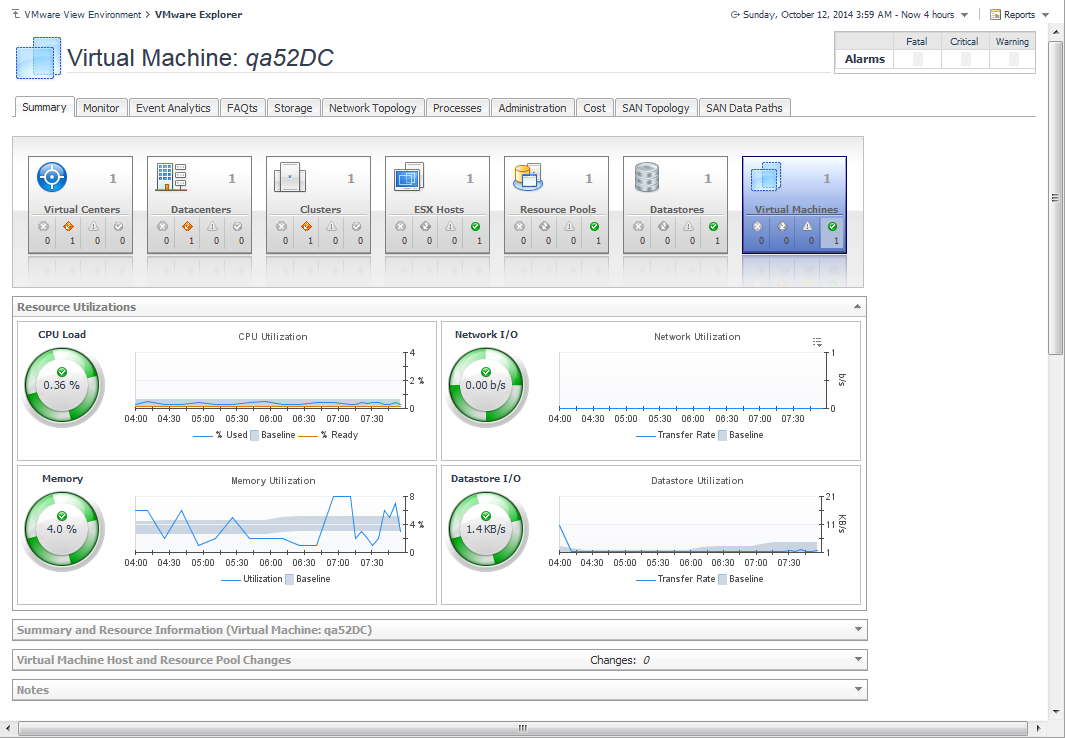
For more information about using VMware View dashboards, see Interact with Foglight for VMware Horizon View dashboards.

Time range

The default behavior of Foglight for Hyper-V is to display metrics, alerts, and messages that have occurred within the last four hours. This time range, however, is configurable.

To configure the Time Range, use the Time Range popup, which you can access from the upper right corner of the Foglight for Hyper-V browser interface.

Figure 4. Time range

Using the Time Range popup, you can select from predefined time ranges or you can specify a custom range using either a sliding time bar or calendar precision controls to specify dates and times. When you modify the time range for a dashboard or view, it adjusts the range for all of the views contained within and drill-downs accessed from that dashboard or view. It does not adjust the time range for any parent views.

For more information about modifying the time range, see the Foglight for Hyper-V User Guide.

Sortable lists

In certain Foglight for VMware Horizon View dashboards, some levels of views contain sortable lists. An example of this is the VMware Explorer dashboard Virtual Machine table displayed below.

Figure 5. Sortable lists

It is possible to sort this list by column using any of the column headings. Click a column heading once to sort the list in ascending order. The list is redrawn according to your specification. Click the column heading again to re-sort the list in descending order.

This is handy when you want to have an organized view of virtual machines or host objects sorted by name, status, or some other criterion.

Verwandte Dokumente

The document was helpful.

Bewertung auswählen

I easily found the information I needed.

Bewertung auswählen