Use Spotlight on MySQL to monitor your MySQL databases, detect and resolve problems.
|
Section |
Description |
|---|---|
| Connect to a MySQL Database | Create / Modify / Delete connections to MySQL systems. |
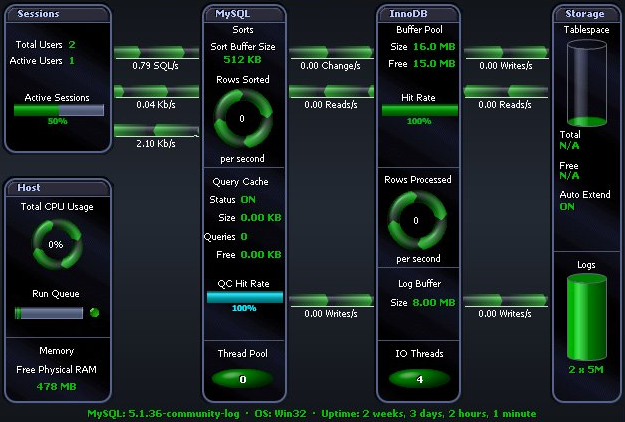
| Spotlight on MySQL Home Page | The Spotlight home page shows the flow of information and commands between various sub-components and the size and status of internal resources such as processes, disk files and memory structures. |
| Spotlight on MySQL Alarms |
Spotlight alerts you to problems with your system by issuing an alarm. You can configure Spotlight in the level of severity that constitutes an alarm, to disable an alarm, and the actions Spotlight takes on raising the alarm. |
| Spotlight on MySQL Drilldowns | When you have isolated a problem, you can display a drilldown page, whose charts and tables provide a detailed breakdown of the underlying statistics. |
Select the database to connect to.

Note: Ensure the Unix or Windows server on which the MySQL database is installed is accessible to Spotlight.
Click File | Connect

Select Spotlight on MySQL on the Connections menu.

Double-click Add new connection.

Fill in the connection Properties | Details page. MySQL Connection Details
| Field | Description |
|---|---|
| Connection name |
This is the display name for the connection in Spotlight. Tip: Fill in the Host field first. |
MySQL connection details
| Field | Description |
|---|---|
| Host | Enter the name of the host machine for the MySQL database. |
| Username |
Enter the user name to login to the MySQL database. |
| Password |
Enter the password to login to the MySQL database. |
| Port | Enter the port used for the Spotlight on MySQL connection. The default value is 3306. |
| Database | Select the name of the database that you wish to connect to. |
OS Connection Details
Click Save password details (for this connection) to save all the entered password details.
The Spotlight home page shows the flow of information and commands between various sub-components and the size and status of internal resources such as processes, disk files and memory structures.
Related operating system statistics are grouped together on panels that are connected by a series of graphical flows and icons. Spotlight updates these flows in real time so you can see how quickly data is moving through the system. The icons change color as Spotlight alarms are raised, upgraded, downgraded and canceled.
Tip: Hover the mouse pointer over a panel component for more information.
To see the Spotlight on MySQL Home Page
 .
. 