Summary - Distributed Virtual Switch view
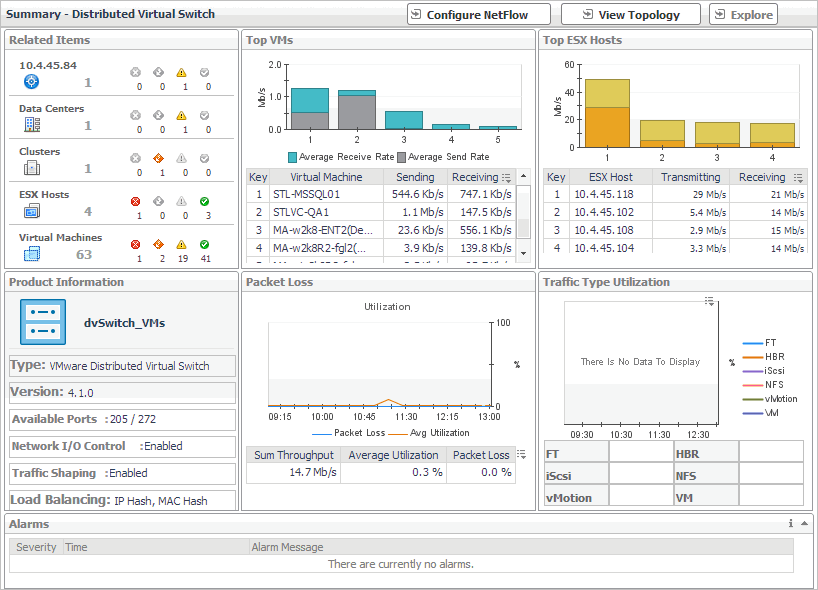
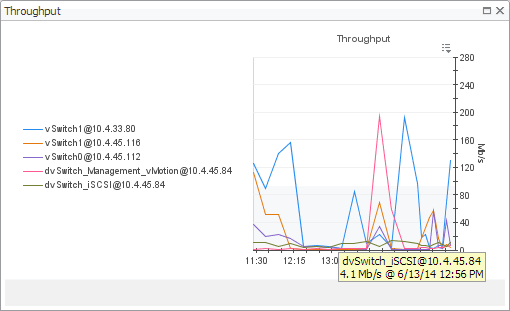
The Summary - Distributed Virtual Switch view illustrates the overall network utilization and the levels of overall network packet loss for a selected distributed virtual switch.
|
1 |
On the VMware Environment dashboard, on the Monitoring tab, in the Virtual Environment Overview, select the Virtual Switches tile. |
|
2 |
In the Quick-View, in the Virtual Switches view, under Distributed Virtual Switches, select a virtual switch. |
For additional information about these privileges, see your VMware documentation.
|
1 |
|
2 |
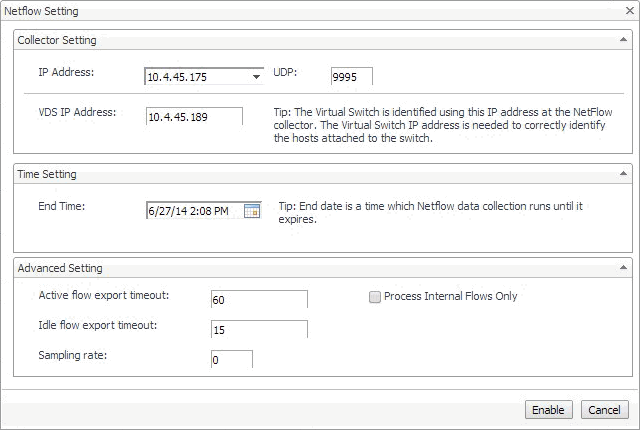
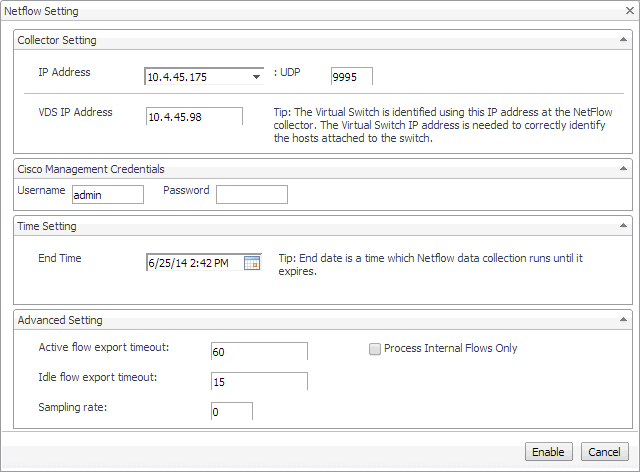
In the Netflow Setting Dialog box, provide the following information: |
|
• |
IP Address and UDP: Type the IP address and port number of the NetFlow collector. |
|
• |
VDS IP Address: Type the IP address of the distributed virtual switch. |
|
• |
End Time: Select the time when you want the collector to stop obtaining NetFlow data. |
|
• |
Active flow export timeout: Type the number of seconds after which an active data flow times out. |
|
• |
Idle flow export timeout: Type the number of seconds after which an idle data flow times out. |
|
• |
Sampling rate: Type a number indicating how often you want to collect data packets. For example, a value of 2 instructs the collector to obtain data from every second packet. |
|
• |
Process Internal Flows: Select this check box if you want to collect data only during network activities between virtual machines on the same host. |
|
3 |
Click Enable. |
This view is made up of the following embedded views:
|
• |
|
• |
For complete information about this view, see Alarms .
For complete information about this view, see Packet Loss .
|
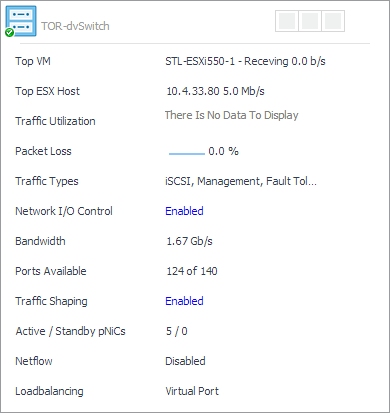
Shows the name of the selected switch along with some basic configuration information. | |||
| |||
| |||
| |||
| |||
| |||
| |||
To find out more about the network I/O traffic passing through the selected switch, in the dwell, on the right of Network I/O Control, click Enabled. To find out more about the traffic shaping policy, on the right of Traffic Shaping, click Enabled. |
For complete information about this view, see Related Items .
|
Identifies the ESX hosts with the highest network transmission rate. | |||
| |||
| |||
| |||
| |||
| |||
| |||
|
For complete information about this view, see Top VMs .
For complete information about this view, see Top VMs .
Summary - Cisco Virtual Switch view
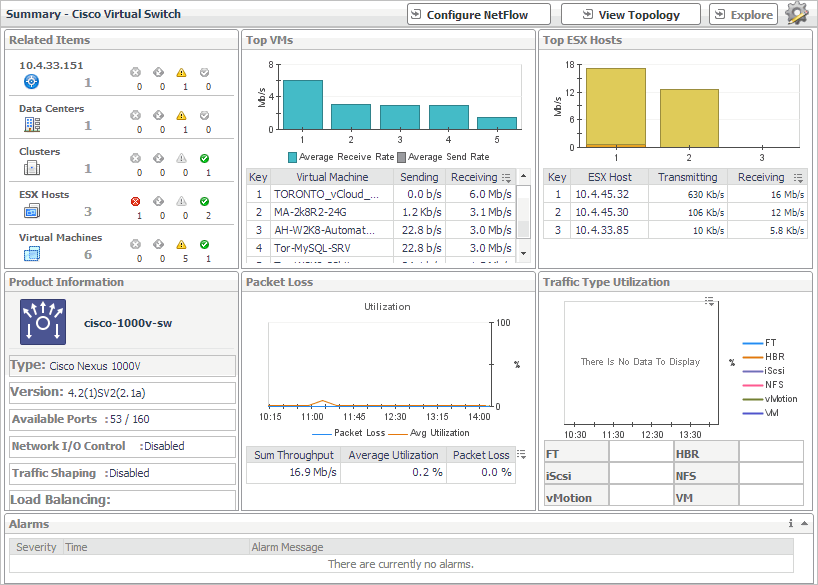
The Summary - Cisco Virtual Switch view illustrates the overall network utilization and the levels of overall network packet loss for a selected Cisco virtual switch.
|
1 |
On the VMware Environment dashboard, on the Monitoring tab, in the Virtual Environment Overview, select the Virtual Switches tile. |
|
2 |
In the Quick-View, in the Virtual Switches view, under Cisco Virtual Switches, select a virtual switch. |
For additional information about these privileges, see your VMware documentation.
|
1 |
|
2 |
In the Netflow Setting Dialog box, provide the following information: |
|
• |
IP Address and UDP: Type the IP address and port number of the NetFlow collector. |
|
• |
VDS IP Address: Type the IP address of the distributed virtual switch. |
|
• |
Username and Password: Type the credentials needed to access the Cisco virtual switch. |
|
TIP: Cisco virtual switch credentials can also be updated using the Configure Switch button on the Summary - Cisco Virtual Switch view. |
|
• |
End Time: Select the time when you want the collector to stop obtaining NetFlow data. |
|
• |
Active flow export timeout: Type the number of seconds after which an active data flow times out. |
|
• |
Idle flow export timeout: Type the number of seconds after which an idle data flow times out. |
|
• |
Sampling rate: Type a number indicating how often you want to collect data packets. For example, a value of 2 instructs the collector to obtain data from every second packet. |
|
• |
Process Internal Flows: Select this check box if you want to collect data only during network activities between virtual machines on the same host. |
|
3 |
Click Enable. |
This view is made up of the following embedded views:
|
• |
|
• |
For more information about these views, see Description of Embedded Views
Standard vSwitch Topology and Distributed vSwitch Topology views
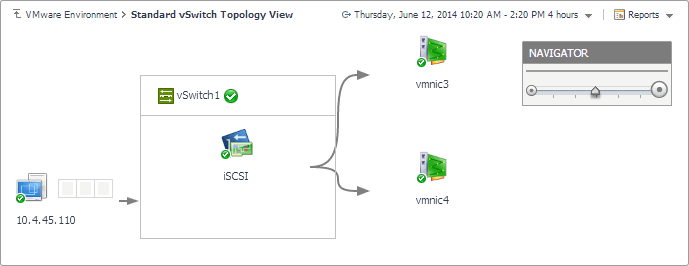
The Standard vSwitch Topology View and Distributed vSwitch Topology View visualize the relationships between the objects in your environment through an interactive dependency map. The map illustrates how different components relate to each other, and the levels of the available resources available to them.
Topology views are also available for other components on the VMware Environment dashboard. For complete information about topology views, see Topology views .
|
1 |
On the VMware Environment dashboard, on the Monitoring tab, in the Virtual Environment Overview, select the Virtual Switches tile. |
|
2 |
To display a standard virtual switch in the Standard vSwitch Topology View, complete the following steps. |
|
a |
In the Quick-View, in the Virtual Switches view, under Standard Virtual Switches, select a virtual switch. |
|
b |
|
3 |
To display a distributed virtual switch in the Distributed vSwitch Topology View, complete one of the following procedures. |
|
a |
In the Quick-View, in the Virtual Switches view, under Distributed Virtual Switches, select a virtual switch. |
|
b |
|
4 |
To display a Cisco virtual switch in the Distributed vSwitch Topology View, complete one of the following procedures. |
|
a |
In the Quick-View, in the Virtual Switches view, under Cisco Virtual Switches, select a virtual switch. |
|
b |
Summary - All Virtual Switches view
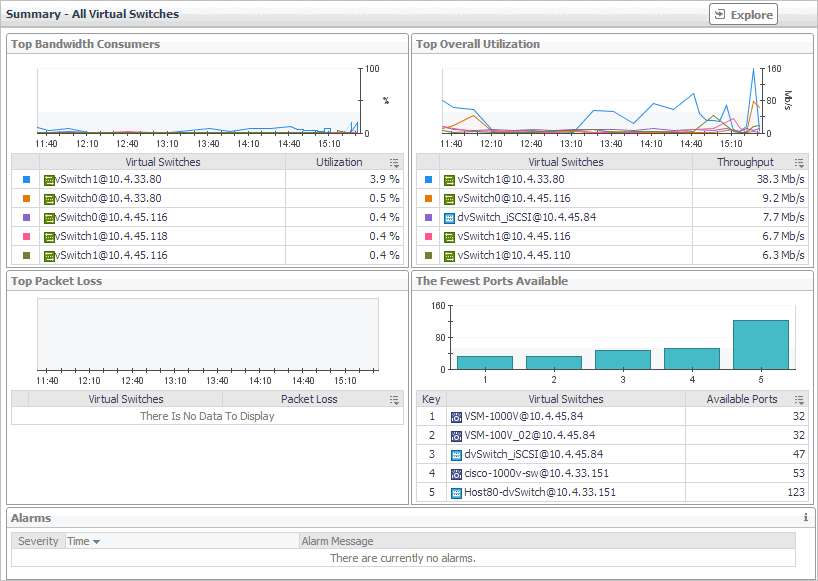
The Summary - All Virtual Switches view displays overall resource utilization information for a group of virtual switches and identifies the elements that consume the highest amount of system resources and may cause potential performance bottlenecks.
|
1 |
On the VMware Environment dashboard, on the Monitoring tab, in the Virtual Environment Overview, select the Virtual Switches tile. |
|
2 |
This view is made up of the following embedded views:
|
• |
For complete information about this view, see Alarms .
|
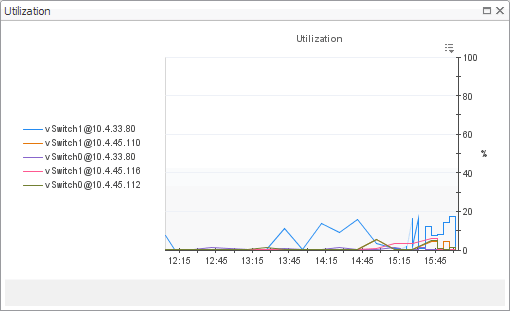
Identifies the virtual switches with the highest percentage of network utilization. | |||
| |||
| |||
| |||
| |||
|
|
Identifies the virtual switches with the fewest numbers of available ports. | |||
| |||
| |||
| |||
| |||
|
|
Identifies the virtual switches with the highest network transfer rates. | |||
| |||
| |||
| |||
| |||
|
|
Identifies the virtual switches with the highest percentage of data packet loss. | |||
| |||
| |||
| |||
| |||
|

