Quick-View
The Quick-View displays summary information about the objects you select from the Virtual Environment Overview, which is also available on the Virtual Environment Summary dashboard.
|
• |
On the VMware Environment dashboard, open the Monitoring tab. |
Resource Pool Summary view
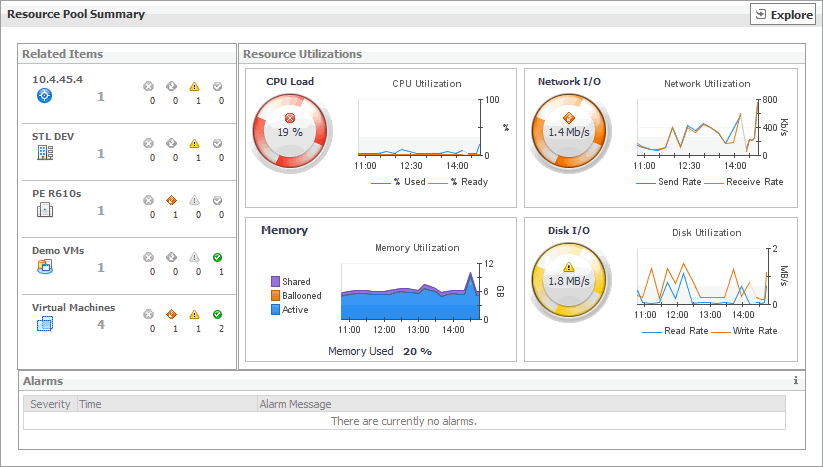
The Resource Pool Summary view shows the overall resource utilization and the amounts of system resource consumption for a physical resource pool.
|
1 |
On the VMware Environment dashboard, on the Monitoring tab, in the Virtual Environment Overview, select the Resource Pools tile. |
|
2 |
This view is made up of the following embedded views:
|
• |
|
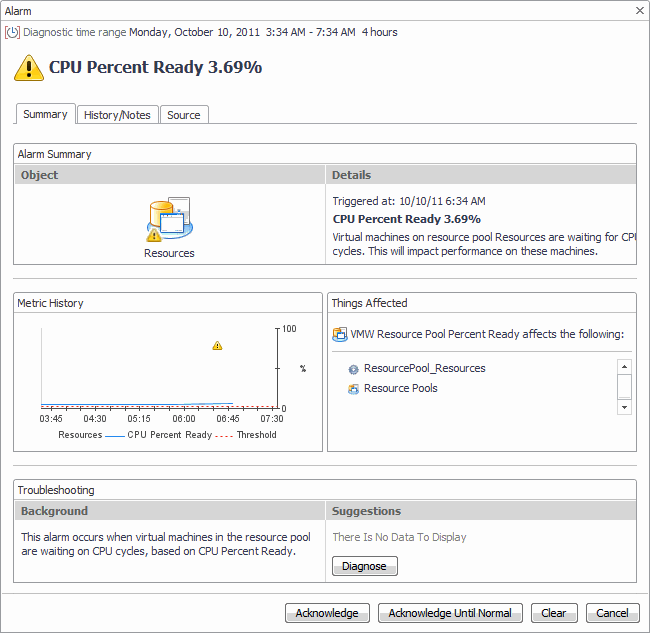
Lists the alarms generated against the selected resource pool. | |||
| |||
| |||
| |||
|
| |||
| |||
| |||
| |||
| |||
| |||
| |||
| |||
| |||
| |||
|
|
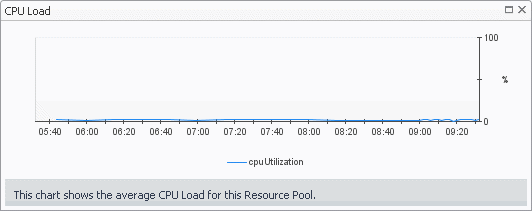
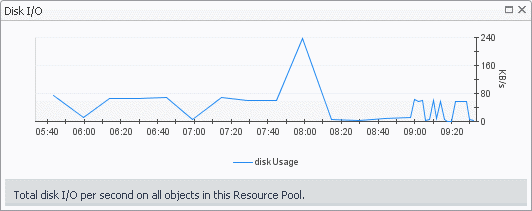
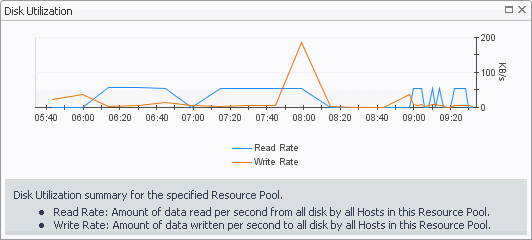
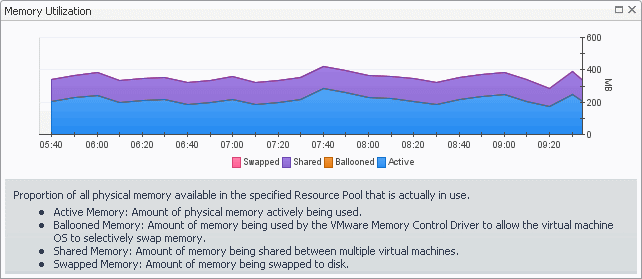
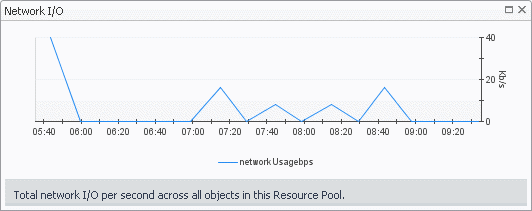
Shows the resource consumption for the selected resource pool broken down into four simple views. | |||
| |||
| |||
| |||
| |||
| |||
| |||
| |||
| |||
| |||
| |||
| |||
| |||
| |||
| |||
| |||
| |||
| |||
| |||
| |||
| |||
|
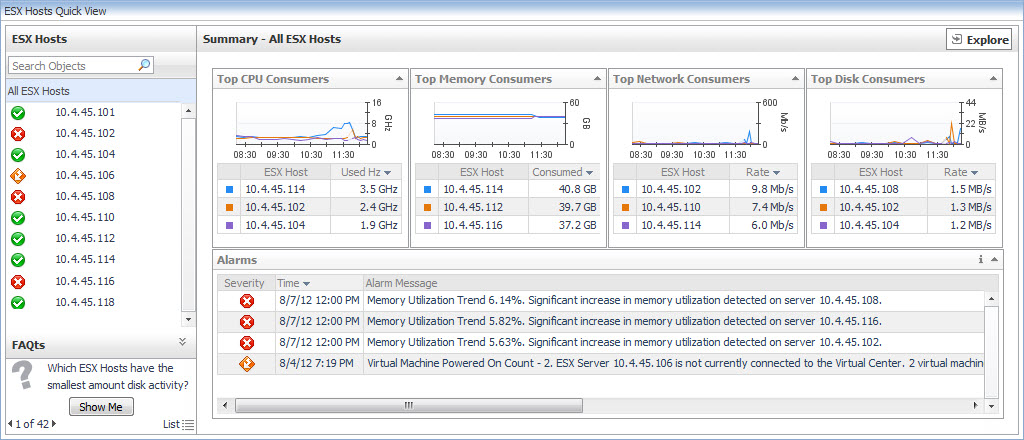
Summary - All Resource Pools view
The Summary - All Resource Pools view displays overall resource utilization information for a group of physical resource pools and shows the elements that consume the highest amount of system resources.
|
1 |
On the VMware Environment dashboard, on the Monitoring tab, in the Virtual Environment Overview, select the Resource Pools tile. |
|
2 |
This view is made up of the following embedded views:
|
• |
| |||
| |||
| |||
| |||
| |||
|
|
Shows the top three resource pools with the highest average CPU utilization. | |||
| |||
| |||
|
|
Shows the top three resource pools with the lowest available disk space. | |||
| |||
| |||
| |||
|
Shows the top three resource pools with the highest average memory utilization. | |||
| |||
| |||
| |||
|
Shows the top three resource pools that are consuming most network bandwidth. | |||
| |||
| |||
| |||
|
Resource Pools view
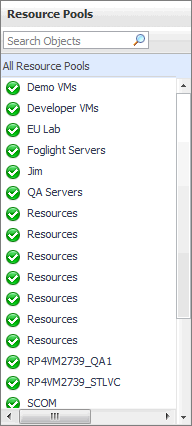
This view is a tree view. It lists the resource pools that exist in your environment and shows their state.
Selecting the All Resource Pools node displays overall resource utilization for all resource pools in your integrated system, and the elements that consume the highest amount of system resources in the Summary - All Resource Pools view on the right. Similarly, selecting a resource pool node shows resource pool-specific metrics in the Resource Pool Summary view on the right.
|
• |
On the VMware Environment dashboard, on the Monitoring tab, in the Quick-View, select the Resource Pools tile. |
| |||
| |||
| |||
| |||
|

