The Web Component Framework Editor
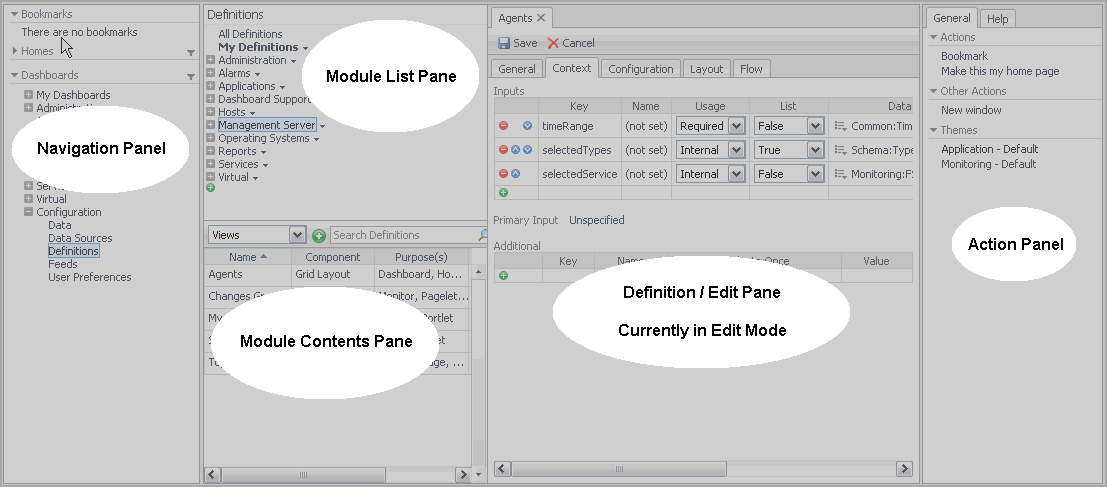
You navigate to the editor by clicking Configuration > Definitions in the navigation panel. Both the navigation and action panels are described in the Foglight™ User Guide.
The Web Component Framework editor consists of the following panes:
|
• |
Module List: This pane displays the existing modules. Most modules are defined by the application developer. You can add your views to the module called My Definitions, which is associated with your login name, although you can add your views anywhere you choose (if you have the proper permissions). Other users can add views as well. If such a user was creating views in his or her My Definitions workspace, you would locate these views under Other User Definitions, where the modules are arranged by login name. |
|
• |
Module Contents: This pane consists of nine tabs. Within each tab you can create the following entities for the selected module: views, queries, functions, renderers, tasks, icons, files, types, and units. |
|
• |
Definitions/Edit: It functions as an editor pane, and as an item definition pane once the item has been configured. You use this pane to edit a new or existing definition. Once the definition is saved the pane switches to a view of the definition showing all the properties that have been changed from their default values. |
In Foglight, you access these panes from Dashboards > Configuration > Definitions in the navigation panel.
An Example Page
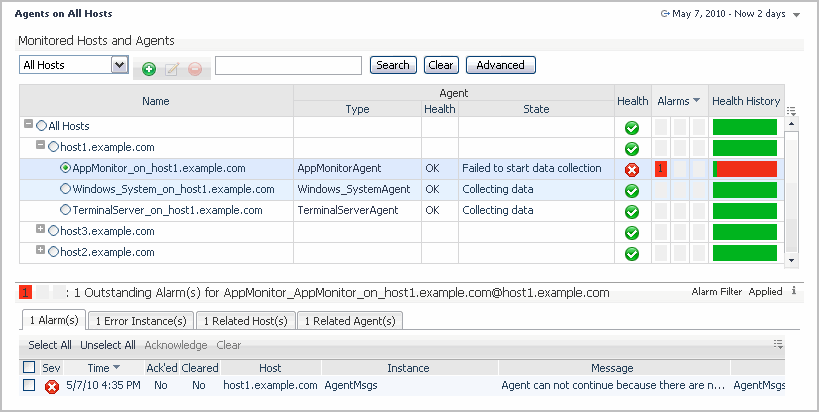
All of the preceding are assembled from view components.
Views can be configured using any of the following mechanisms:
|
• |
Context: What is shown depends on the context passed to the page or component |
|
• |
Queries: Queries provide data binding |
|
• |
Flows: Action to be performed based on user input, such as a drill down page |
Other data binding choices exist. For more information, see Bindings.
View components and their containers have properties that are described in the Web Component Reference. Refer to it for details about these properties.
Managing Dashboards
The following section describes the Dashboard, Definitions, and Data Sources pages.
Definitions Panes
From the Module List pane, accessed in the navigation panel under Configuration > Definitions, you can examine the dashboards that have been defined for all the System and User modules to which you have access. After familiarizing yourself with the available dashboards, you can decide whether a custom one needs to be built, or you can perhaps copy and modify an existing one, instead of creating a new dashboard from scratch.


