PMU Count — Number of 100 and 101 PMUs executed during the collection interval.
•
Avg Duration Time(s) — Average execution time for all completed 100 and 101 PMUs at the PeopleSoft enterprise level during the collection period.
•
Web Server Load % — The processing load consumed by a Web Server as a percentage of the enterprise-wide processing load. The calculation for Web Server Load % is:
Web Server Load (%) — The processing load consumed by a Web Server as a percentage of the enterprise-wide processing load. The calculation for Web Server Load % is:
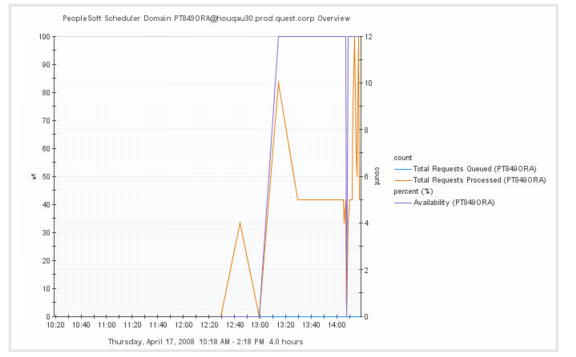
Total Requests Queued — The current length of the queue, measured by the number of requests waiting to be processed for the PeopleSoft Process Scheduler server domain at the time of data collection. A high number indicates that there are insufficient server processes configured, or that the load on the host computer is too high.
•
Total Requests Processed The total number of requests a server process processed for all server groups during the collection interval.
•
Availability % — Measures the minimum availability of the overall PeopleSoft Process Scheduler server domain. Availability is based on the minimum number of instances defined for a server process in the .ubb file. If Instances Found are less than Min Instances for any server process within the domain, then Availability % equals zero. If Instances Found equals Min Instances, then Availability % equals 100.