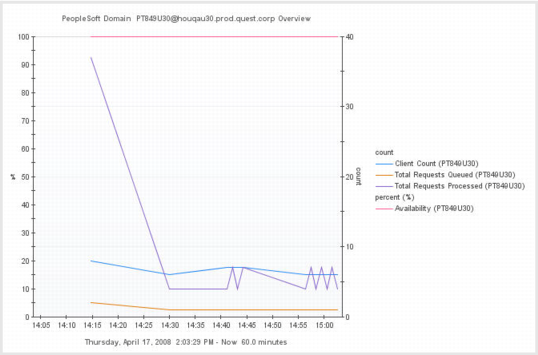
Client Count — Client count is the number of handlers (work station and jolt station) plus the number of Peoplesoft application users logged on at the time of data collection.
•
Total Requests Queued — The current length of the queue, measured by the number of requests waiting to be processed for the PeopleSoft application server domain at the time of data collection. A high number indicates that there are insufficient server processes configured, or that the load on the host computer is too high.
•
Total Requests Processed — The total number of requests a server process processes for all server groups during the collection interval.
•
Availability (%) — Measures the minimum availability of the overall PeopleSoft application server domain. Availability is based on the minimum number of instances defined for a server process in the .ubb file. If Instances Found are less than Min Instances for any server process within the domain, then Availability % equals zero. If Instances Found equals Min Instances, then Availability % equals 100.
Availability (%) — Measures the minimum availability of the overall PeopleSoft application server domain. Availability is based on the minimum number of instances defined for a server process in the .ubb file. If Instances Found are less than Min Instances for any server process within the domain, then Availability % equals zero. If Instances Found equals Min Instances, then Availability % equals 100.
•
CPU Utilization (%) — The percentage of CPU resources used by all the processes belonging to the application server domain.
•
Memory Utilization (%) — The percentage of memory resources used by all the processes belonging to the application server domain.