立即与支持人员聊天
与支持团队交流

Foglight APM for Real User Experience 5.9.9 - User Guide

Getting started with Foglight APM Monitoring transactions Viewing real user activity from a geographical perspective Assessing real user experiences during key sequences Monitoring the performance of web sites and endpoints Searching APM data Replaying sessions, hits, and sequences Visualizing search results Creating custom drag-and-drop dashboards APM tile and view reference

ESX Server detail view

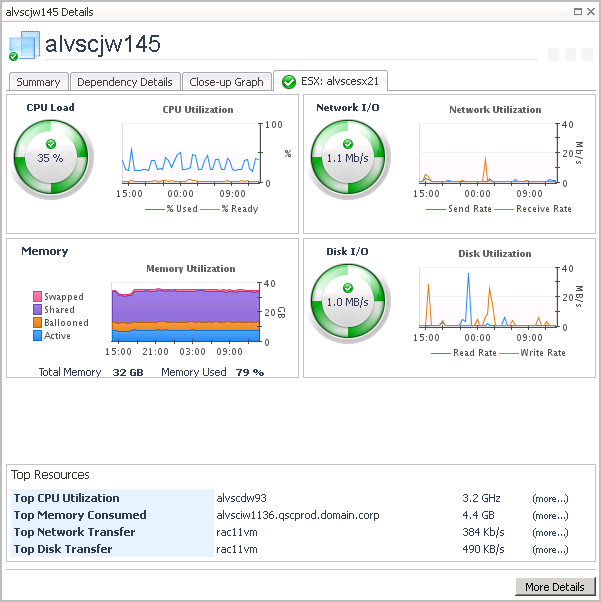
This tab displays the CPU, Memory, Network, and Disk utilization for the <hostname> from the perspective of the ESX® server. The lower part of the tab displays the top resource consumers for this host. From this tab you can navigate to the vmExplorer dashboard by clicking More Details. This dashboard allows you to further investigate the performance of the selected ESX® host.
Click More Details to drill down to a vmExplorer view.

Topology object name reference table

Host1

1
For hosts, always select the host object, regardless of whether or not the host is virtual (for example, Hyper-V® or VMware®). Foglight looks for the appropriate host extensions and displays the associated host dashboard (physical or virtual).

相关文档

The document was helpful.

选择评级

I easily found the information I needed.

选择评级