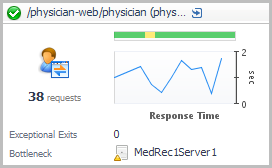
Hits. The number of calls served in the most recent collection interval.
•
Health History Bar. The color-coded bar represents the alarm state of the monitored component over the time range selected in the SOC. The color of the bar changes depending on the alarm state. Red indicates a Fatal state, orange indicates Critical, yellow means Warning, and green is the Normal state.
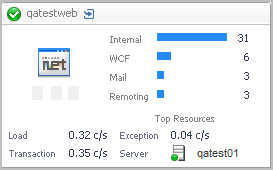
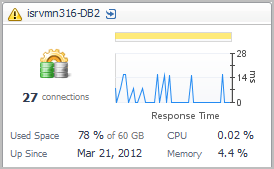
Number of Connections. The sum of the average number of local and remote DB2 connections.
•
Health History Bar. The color-coded bar represents the alarm state of the monitored component over the time range selected in the SOC. The color of the bar changes depending on the alarm state. Red indicates a Fatal state, orange indicates Critical, yellow means Warning, and green is the Normal state.
•
Response Time. A plot of the database response time.
•
Used Space. The average amount of database space used, as a percentage of the total space available.
•
Up Since. The date the database was last restarted.