立即与支持人员聊天
与支持团队交流

MessageStats 7.8.1 - Reports User Guide

Upgrading MessageStats Overview Typical MessageStats Upgrade Scenarios Moving the MessageStats Database Moving and Upgrading MessageStats Moving Custom Reports and Report Subscriptions Viewing, Creating, and Editing MessageStats Reports My Reports and Corporate Reports Exchange Executive Summaries Reports Exchange Organizations Reports Exchange Server Reports Exchange Content Analysis Reports Exchange Mailboxes Reports Exchange Mail Contacts Reports Exchange Distribution Groups Reports Exchange Public Folders Reports Exchange Storage Reports Exchange Internet Reports Exchange Inventory Reports Migration Reports MessageStats Gathering Reports Appendix A: How to Read the Reports Report Filter Definitions

Using the Listview

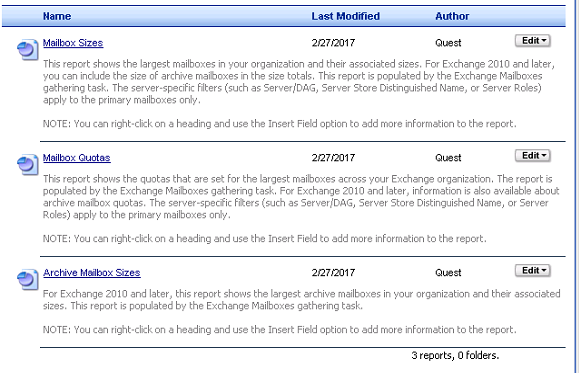
MessageStats Reports uses a listview model to display the available reports. When you select a folder from the treeview, the contents of the folder are displayed in the right pane in a file-based format.

Folder Icon

Reveals the subfolders and files contained within the folder.

Report Icon

Displays the report in the right pane.

Name

Displays the title of the report. The title is a hyperlink that you can click to display the report in the right pane.

Last Modified

Displays the date stamp of the last time the report was modified.

Author

Displays the name of the report author. For reports that are supplied with the MessageStats application, the Author is blank. For Custom reports that you create, the report author is displayed.

Report Description

Displays a description of the report, if applicable.

n reports, n folders.

Indicates the number of reports and subfolders in the main folder.

Edit

Displays the Edit menu. For information, see Using the Edit Button .

Using Linked Reports

There are hyperlinks on some pages that allow you to penetrate deeper into the report content. Some links join two reports in the treeview, while other links move from a report in the treeview to a report that does not appear in the navigation tree.

Viewing Report Information

Located at the lower-right of each report, there is an Information button. Select the button to view the filters, report parts, and data sources that are used in the report.

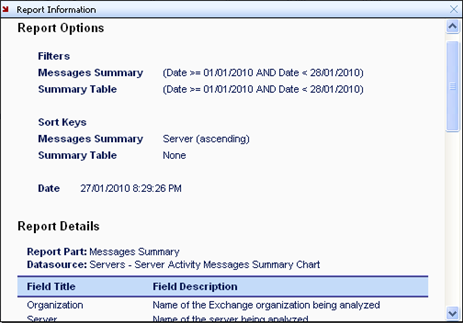
The following illustration shows an example of report information:

The following information is available:

Report Options include default filters and sort keys, as well as any quick filters and sort keys you selected using the Quick Filter options.
Report Details include a list of the report parts (tables and graphs) that comprise the report. This section also shows a list of the data sources and all the fields (and the field descriptions) that are used.

By determining the parts and data sources that comprise a standard report, you can use the information to create custom reports or custom graphs that show similar information, but with changes or additions to meet your own needs.

For information about custom reports, see Creating Custom Reports . For information about custom graphs, see Creating Custom Graphs .

Configuring Report Parts

Parts are report components that contain either text-based tabular information (tables) or graphs that you can include in certain reports. You can select the parts that you want to include in a report and the order in which they appear.

1
Select the My Reports node in the treeview, and click Configure Parts.
3
Select a part in the Configured Parts pane and click Configure to select the settings for each part.
5
Click OK to generate your report.
1
Select the My Reports node from the treeview, and click Configure Parts.
3
Click OK to generate your report.
相关文档

The document was helpful.

选择评级

I easily found the information I needed.

选择评级