There are five steps to use the Memory Management Page. This page documents Steps 2 and 4.
Review your changes against the charts whenever you change the memory management mode, global memory, and fine tune memory components.
To use the Memory Management Page
| Chart | Description | Actions |
|---|---|---|
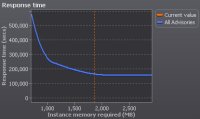
| Response Time |
Shows the Oracle Advisory for the component selected in Memory Components. |
Estimate how much total memory you should allocate in order to minimize response time. Ensure the Calculated sizes of individual memory components are close to the sizes recommended by the Oracle Advisories. |
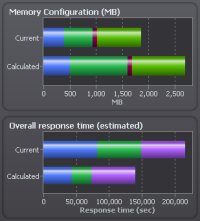
| Memory Configuration (MB) |
Compares the total size of the Current Oracle memory components to the estimated size Calculated from Oracle Advisories. |
|
| Overall Response Time (estimated) |
Compares the Current value for response time to the estimated value Calculated from Oracle Advisories. |
Ensure the Calculated value for Overall Response Time is lower than the Current value. |
Note: The charts are color-coded to match the Memory Components table.
Sample Charts
| Sample Charts | Description |
|---|---|
|
|
Large values in the Overall Response Time chart are cumulative values used to provide advice and NOT actual database response times. (For example, this chart indicates that adopting Spotlight's calculated values for memory size should improve response times for the database, but it does NOT give specific values for response times.) |
|
|
In the example shown, the blue All Advisories line estimates how the response time varies with the total memory allocated to ALL Oracle processes. The vertical orange line indicates the amount of Oracle memory allocated NOW. (In the example, it suggests that the current value is close to that recommended by the Oracle Advisory.) |
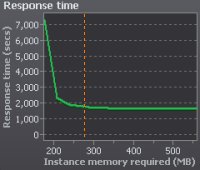 |
Fine-tune and review the allocation of memory components. To do so, use the Response Time chart to ensure that the Calculated sizes of individual memory components are close to the sizes recommended by Oracle Advisories.
|