If overall the catalog cache hit rate for the database is low, this graph tells you whether the selected application is contributing to the problem.
Catalog cache is memory that temporarily holds table descriptors. Table descriptors are stored in the system catalog. Each descriptor contains information about a table, view, or alias in a condensed internal format. When a transaction references a table, it also inserts a descriptor for the table into the catalog cache. Subsequent transactions referencing this same table can then use the descriptor stored in cache and avoid reading this information from the system catalog.
The descriptor for a table, view, or alias is kept in the catalog cache until one of the following occurs:
A DDL statement is run against the table, thereby purging that table entry in the system catalog.
Space is needed in catalog cache to insert another descriptor. However, a table descriptor is not removed from cache until all units of work referencing the table have completed.
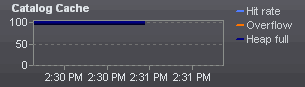
The following series appear in the Catalog Cache graph:
Hit rate —Plots the percentage of catalog cache lookups at the application level that were satisfied by descriptors already in the catalog cache. If the hit rate is generally high, the cache is performing effectively. Lower hit rates indicate that the application is performing more reads directly from the system catalog than from the catalog cache and might therefore be contributing to the overall low hit rate for the database.
Overflow —Plots the percentage of catalog inserts at the application level that failed because the catalog cache was full. If overflow rates are generally high for the application, the application workload might be contributing to the cache being full. If the workload includes transactions that compile a large number of SQL statements referencing many tables, views, and aliases in a single unit of work, you might try compiling fewer SQL statements in a single transaction. Likewise, if the workload is binding packages that contain many SQL statements referencing many tables, views, or aliases, try splitting the packages so that they include fewer SQL statements.
Heap full —Plots the percentage of inserts that failed for this application because the database heap could not accommodate the size of the catalog cache as configured. Catalog cache dynamically uses space from the database heap. Even if the catalog cache has not reached its limit, inserts into this cache can fail due to lack of space in the database heap. If heap full rates are generally high for this application, it might be contributing to the overall lack of heap space for the database.
The graph title area shows the number of catalog cache inserts and lookups that occurred during the last monitoring interval.
The Statistics tab contains entries for all the catalog cache statistical counts used to generate this graph. The names for these statistics begin with Catalog Cache. These statistics are derived from the CAT_CACHE data elements that the DB2 snapshot monitor captures.
