Configuring e-mail Settings
Metalogix Diagnostic Manager uses email settings:
·to send e-mail notifications when warning or critical conditions you define occur
AND
·for the distribution of scheduled reports.
You use the Alert Thresholds dialog to specify when Metalogix Diagnostic Manager generates an alert. You use the Alert Responses dialog to configure how Metalogix Diagnostic Manager responds to the alert, including when Metalogix Diagnostic Manager sends email notifications.
|
|
NOTE: Metalogix Diagnostic Manager only sends an e-mail when an alert changes status, not when an alert remains in the same state. |

To configure the e-mail settings:
1.In the Management left hand panel select Options and then in the options section, choose Email.

2.Complete the Email Information section as describe in the following table.
|
Field |
Data to Enter |
|---|---|
|
Sender Address |
The e-mail address that appears as the sender of the e-mail. |
|
Reply-to Address |
The e-mail address that appears as the reply-to address. All replies to the message are sent to the address you specify. You must specify a reply-to address to receive replies to the email. |
|
Message Footer |
Text that you want to appear in the footer of the e-mails Metalogix Diagnostic Manager sends. Metalogix Diagnostic Manager includes the text that you specify in every alert email that it sends. |
3.Complete the Outgoing Mail Server Information section as described in the following table.
|
Field |
Data to Enter |
|---|---|
|
SMTP Server Address |
The name or Internet Protocol (IP) address of your SMTP mail server. |
|
SMTP Server Port |
The IP port that the SMTP mail server uses. (The default SMTP port is port 25.) If you want Metalogix Diagnostic Manager to use SSL encryption to connect to the mail server, check Use an SSL encrypted connection. |
|
SMTP Server required authentication |
If your SMTP server requires authentication:
·check this box AND ·specify a valid user name and password that Metalogix Diagnostic Manager can use to access the mail server. |
4.To use the settings you specified to send a test message click Test Email Settings.
|
|
NOTE: Metalogix Diagnostic Manager prompts you for the email address to which you want to send the test message. |
5.Click OK.
Configuring the SNMP Settings
You can use the Metalogix Diagnostic Manager to generate Simple Network Management Protocol (SNMP) Traps in response to Alerts. The traps generated by Metalogix Diagnostic Manager comply with version 1 of the SNMP standards. You can use the Management information base (MIB) file and the generated traps in conjunction with your SNMP management software to respond to alerts.
|
|
NOTE: Metalogix Diagnostic Manager only generates SNMP traps in response to Metalogix Diagnostic Manager alerts and does not act as an SNMP agent. |
Metalogix Diagnostic Manager includes an MIB file that is installed on the computer that hosts the Management Console. The file name is .mib. The file is installed at the top level of the installation directory.
You can use the MIB file with your SNMP management software to collect the SNMP traps that Metalogix Diagnostic Manager generates. See your SNMP management tool or consult your SNMP administrator for information about installing and using the MIB file.
To configure the SNMP settings:
1.In the Management Console left hand panel, choose Options then select SNMP.
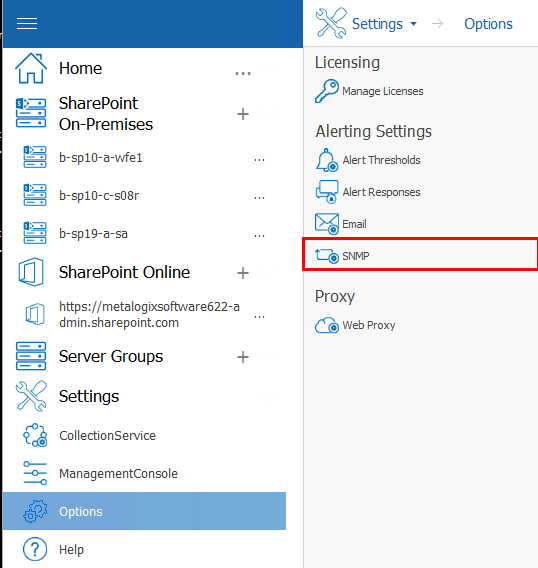
2.Complete the SNMP Settings dialog as described in the following table.
|
|
NOTE: The administrator of your SNMP management tool should be able to provide this information |
|
Field |
Description |
|---|---|
|
SNMP Server Address |
The IP Address or the name of the SNMP server to which generated traps should be sent. |
|
Port |
The Port on which the SNMP management software listens. |
|
Community |
The name of any SNMP community to use for the provider |
3.To use the settings you specified to send a test message click Test SNMP Settings.
4.Click OK.
5.In your SNMP management tool, verify that the trap was received correctly.
Enabling and Configuring the Collection of ULS Log Entries (SharePoint 2010, 2013, and 2016 On Premises)
You can use Metalogix Diagnostic Manager to collect ULS log entries from SharePoint then to sort, filter, and group by a variety of criteria to further monitor the health of your SharePoint environment and diagnose potential issues. From the Collection Service Options - ULS tab, you can enable the collection of ULS log entries from SharePoint (synchronized across all monitored farms), specify what level of log entry you want to be collected, how often you want them to be collected, and how long you want them to be retained.
|
|
NOTE: This feature is not available for SharePoint 2007 or Office 365 tenants. |
Prerequisites
·For the SharePoint timer job to collect ULS log data, usage and health data collection must be enabled in SharePoint. For details, refer to the applicable Microsoft TechNet article:
·In order to use the Metalogix Diagnostic Manager ULS Log Viewer:
§The latest version of the Metalogix Diagnostic Manager Component Analysis Solution must be installed and deployed to every farm whose ULS log entries you want to view.
§The Metalogix Diagnostic Manager ULS Synchronizer must be activated. (This feature is initially activated as part of the Component Analysis installation).
·Remember that the Collection Service account must have the appropriate VIEW permissions to the SharePoint Logging database. See the Account Requirements topic in the Metalogix Diagnostic Manager Advanced Installation Guide for complete Collection Service account requirements.
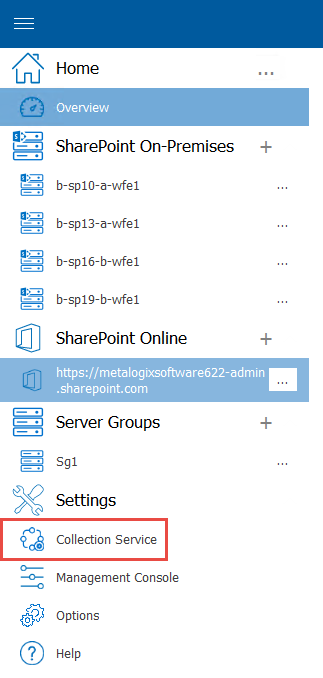
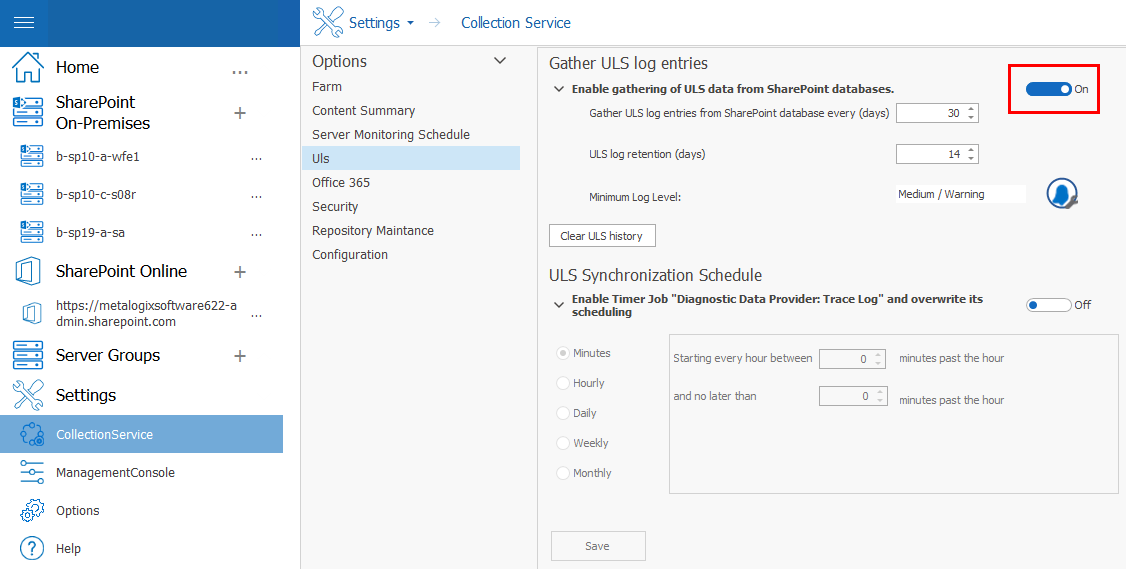
To enable and configure the collection of ULS log entries:
1In the Management Console left hand panel, select Collection Service.
2Click the ULS tab.
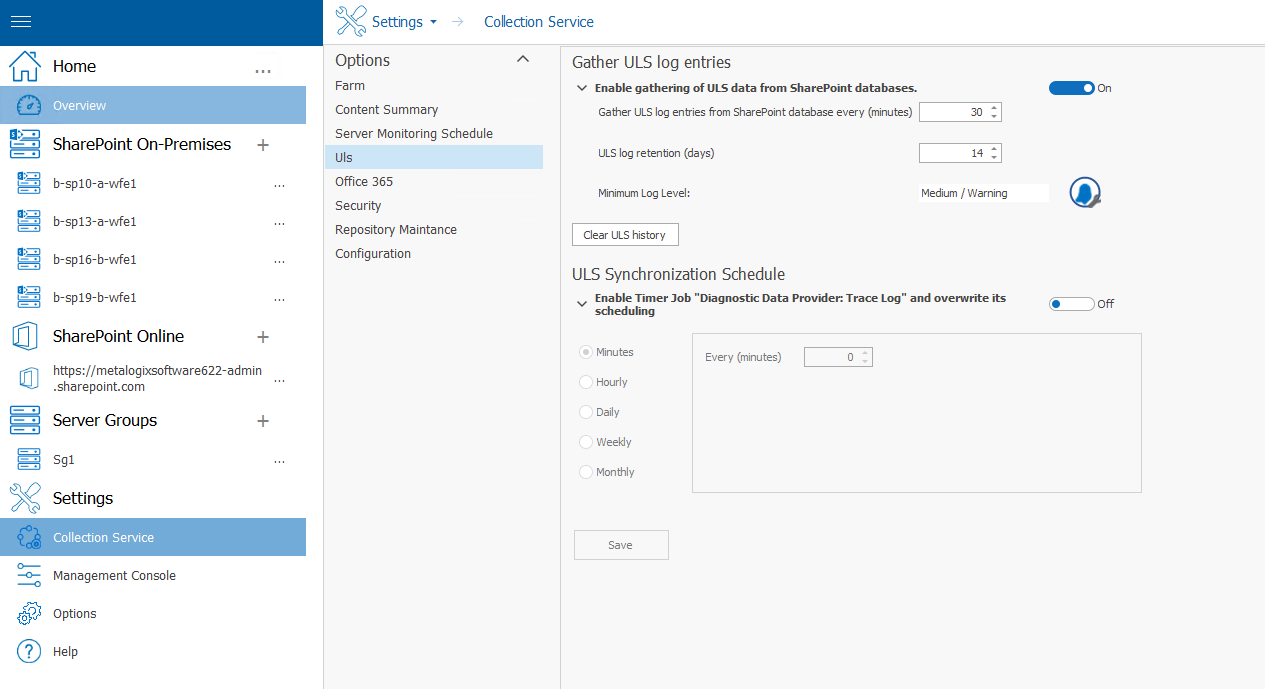
3The ULS tab contains the following options.
|
Option |
Description |
|---|---|
|
Enable gathering of ULS data from SharePoint databases |
When this box is checked, Metalogix Diagnostic Manager will be permitted to gather ULS data from SharePoint once the ULS Synchronization Schedule has been enabled and set. |
|
Gather ULS log entries from SharePoint Database |
How often the Collection Service should gather ULS log entries from SharePoint. |
|
ULS log retention |
The number of days Metalogix Diagnostic Manager should retain ULS log entries in the Repository database. |
|
ULS Synchronization Schedule |
Enables the SharePoint Timer Job Diagnostic Data Provider: Trace Log and overrides the schedule set in Central Administration for all monitored farms and servers. Caution: If the Diagnostic Data Provider: Trace Log timer job has never been enabled in SharePoint or has not been run recently, the synchronization of what may be a significant amount of accumulated log data across multiple servers and/or farms is required. Therefore, the time it takes to complete the initial synchronization may range from several minutes to several hours. Subsequent synchronizations are performed incrementally, and therefore can be completed in much less time. |
|
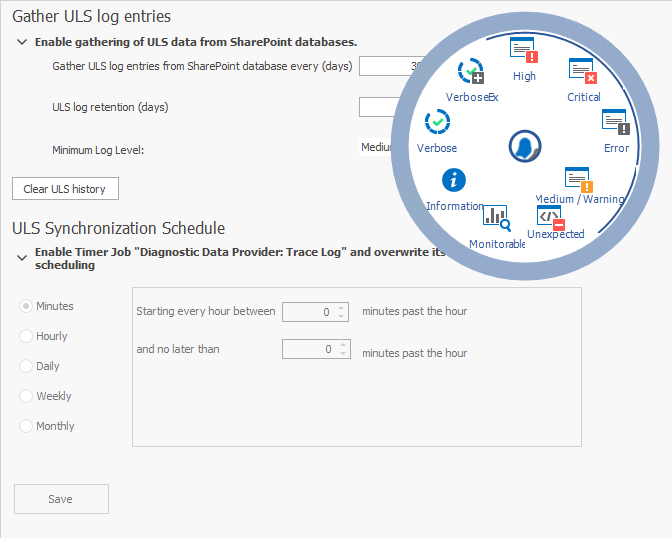
Minimum Log Level |
The minimum level of severity for which Metalogix Diagnostic Manager will gather ULS log entries. (That is, Metalogix Diagnostic Manager will gather only log entries that are of the severity you specified and higher.) Click the See "Minimum Log Entry Level Values," following for descriptions and rankings of log entry severity levels. |
 icon to display the options from which to select.
Minimum Log Level Values
The following table describes the available Minimum Log Level values, listed from highest to lowest severity.
|
Level |
Definition |
|---|---|
|
High |
General functional detail for the high priority events that happen in the environment. Examples include global configuration modifications, service start and stop, timer jobs completed, and so on. |
|
Critical |
Events that demand the immediate attention of the system administrator. They are generally directed at the global (system-wide) level, such as System or Application. They can also be used to indicate that an application or system has failed or stopped responding. |
|
Error |
Events that indicate problems, but in a category that does not require immediate attention. |
|
Medium/Warning |
Events that provide forewarning of potential problems. Although not a response to an actual error, a warning indicates that a component or application is not in an ideal state and that some further actions could result in a critical error. |
|
Unexpected |
A logic check failed that is not typical, or the message returns an unexpected error code. These generally represent code bugs that should be investigated and fixed. |
|
Monitorable |
Traces that indicate a problem, but do not need immediate investigation. The intent is to collect data and analyze it over time, looking for problem trends. |
|
Information |
Events that pass noncritical information to the administrator, similar to a note that says: "For your information." |
|
Verbose |
Verbose status, such as progress or success messages. |
|
VerboseEx |
Useful for traces that are likely to be high volume, especially information that is not needed for all debugging scenarios. Examples of situations where you should use the VerboseEx setting are method entry and exit events, tracing in loops, or to relay information that is not useful to developers outside your team. |
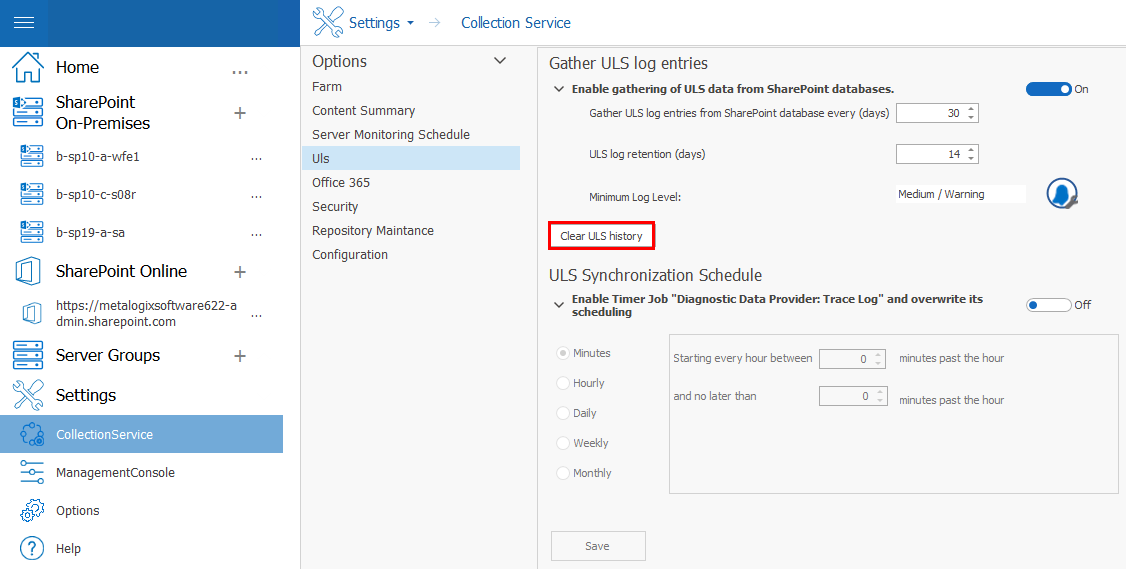
Disabling the Gathering of ULS Log Data and Clearing ULS Log History
To disable the gathering of ULS data by Metalogix Diagnostic Manager:
|
|
NOTE: The disabling of ULS data gathering by Metalogix Diagnostic Manager does not disablenor does it change the current schedule ofthe Diagnostic Data Provider: Trace Log timer job in SharePoint. If you want to disable the timer job itself, you can do so via SharePoint Central Administration. |
On the Collection Service Options - ULS tab, move the Enable Gathering of ULS data from SharePoint databases toggle to off box.
To clear ULS Log History from the Metalogix Diagnostic Manager Repository database:
On the Collection Service Options - ULS tab, click Clear ULS History.