
Viewing SQL Server Detail
The SQL Servers object in the farm or Server Group includes a separate page for every SQL Server being monitored. You can click the page for the server in the SQL Servers group to view additional information about the server (see Viewing the Status of a Single SQL Server).
|
|
NOTE: By default, the Collection Service monitors only content databases and system databases in a SharePoint farm. You can, however, change the Farm & Page Monitoring Scheduled Options to have it monitor all databases. (The Collection Service always monitors all databases in a Server Group.) |

Viewing the SQL Servers Status Overview
The SQL Servers Dashboard provides the status of the SQL Server hosts and gives you an idea of how well you are utilizing SQL Server. This overview helps you focus on any SQL Server configuration or performance issues.
To view the SQL Servers Dashboard
1In the Management Console tree, select the farm whose SQL Servers you want to view.
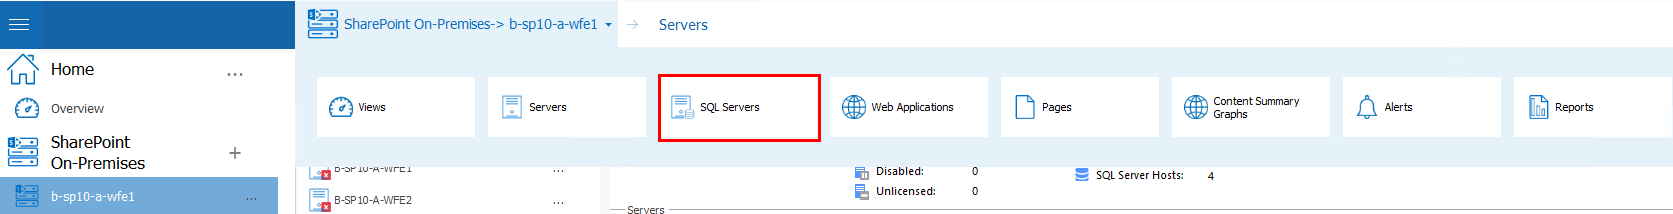
2Select the name of the farm above the overview pane, this will provide a drop down panel, select SQL Servers.
The SQL Servers Dashboard provides the following information:
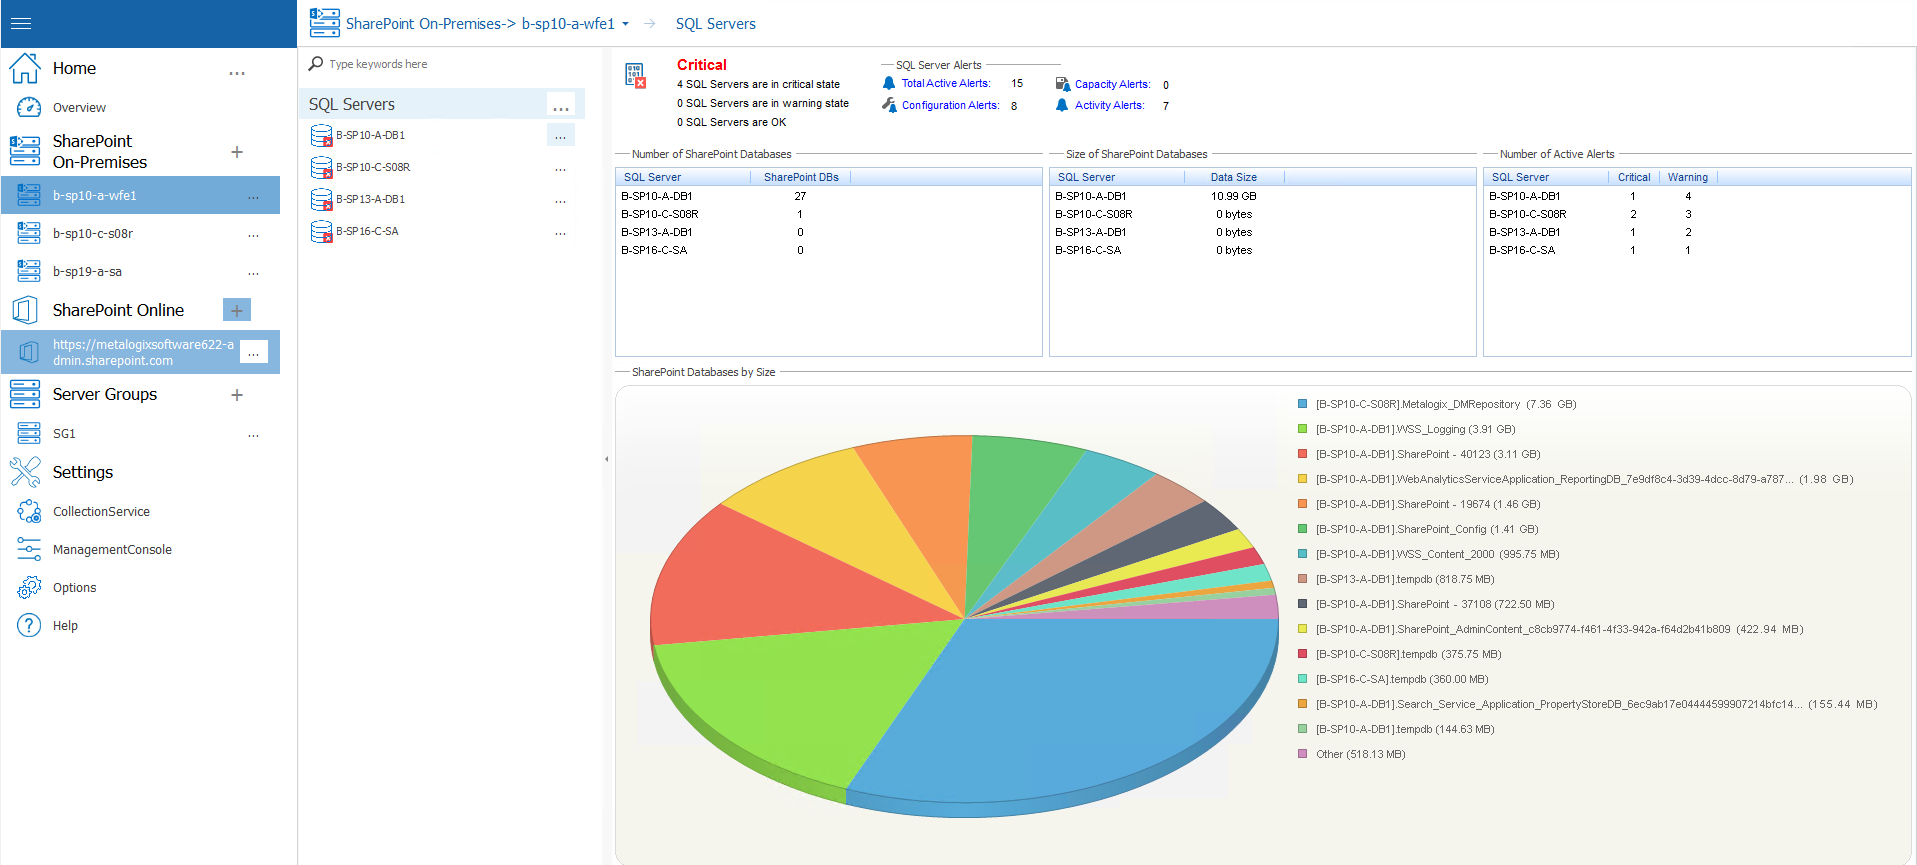
·the state of each server hosting SQL Server components
·the total number of SQL Server Alerts, and the number of alerts by type (Configuration, Capacity, and Activity)
·the Number of Databases on each SQL Server instance
·the Size of Databases on each SQL Server instance
·the Number of Active Alerts (Critical and Warning) for each SQL Server instance
·a pie chart that depicts Databases by Size on the SQL Server instances
|
|
NOTE: Metalogix Diagnostic Manager displays the maximum and minimum server memory statistics in the SQL Server instance details area of the Overview tab. Note that the Min Server Memory field displays the running SQL Server configuration value rather than the value configured in the Server Properties dialog box. |
The Metalogix Diagnostic Manager Collection Service retrieves data from the farm on a schedule that you specify (see Setting the Collection Service Options) in the Collection Service Options dialog box. By default, the Collection Service retrieves data every six minutes.
When you select a server, the Collection Service retrieves live data from the server while it is selected. Live data collection is identical to normal data collection, except that rather than happening at the regular interval you specify for every server, data is collected for the single server at a short interval. By default, live data is collected for the server every 30 seconds. If you need to, you can change the live data collection interval (see Setting the Management Console Options).
Viewing the Configuration of Your SQL Servers
Metalogix Diagnostic Manager provides a glimpse into the configuration of the SQL Server hosts in your SharePoint farm or Server Group. Being able to view configuration information in this view allows you to quickly see how to address alerts concerning a SQL Server host.
To view configuration for your SQL Server hosts:
1In the Management Console tree, select the farm whose SQL Servers you want to view.
2Select the name of the farm above the overview pane, this will provide a drop down panel, select SQL Servers.
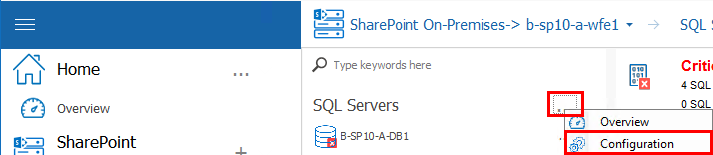
3Next to "SQL Servers", select the (...) button, and select Configuration from the drop down menu.
The SQL Servers Configuration view provides a list of your SQL Servers and the following information:
·The name of the SQL Server host.
·The current Status of your SQL Server host.
·The total number of active configuration, and performance Alerts for the selected host
·The name of the Host Server for the SQL server instance
·If the host server is in a cluster or SQL AlwaysOn Availability Group, the name of any Passive Hosts
·The total number of databases on the host that support SharePoint (SPDBs)
·The total number of SharePoint content databases (Content DBs) on the host
·The current status of Config, Storage Capacity, and Activity on the host
·Details for SQL Server Instance, which includes:
§Version
§Max/Min Server Memory
§Packet Size
§whether the host is in a cluster
§any aliases
SQL Server Data Collection
The Metalogix Diagnostic Manager Collection Service retrieves data from the farm on a schedule that you specify (see Setting the Collection Service Options) in the Collection Service Options dialog box. By default, the Collection Service retrieves data every six minutes.
When you select a server, the Collection Service retrieves live data from the server while it is selected. Live data collection is identical to normal data collection, except that rather than happening at the regular interval you specify for every server, data is collected for the single server at a short interval. By default, live data is collected for the server every 30 seconds. If you need to, you can change the live data collection interval (see Setting the Management Console Options).
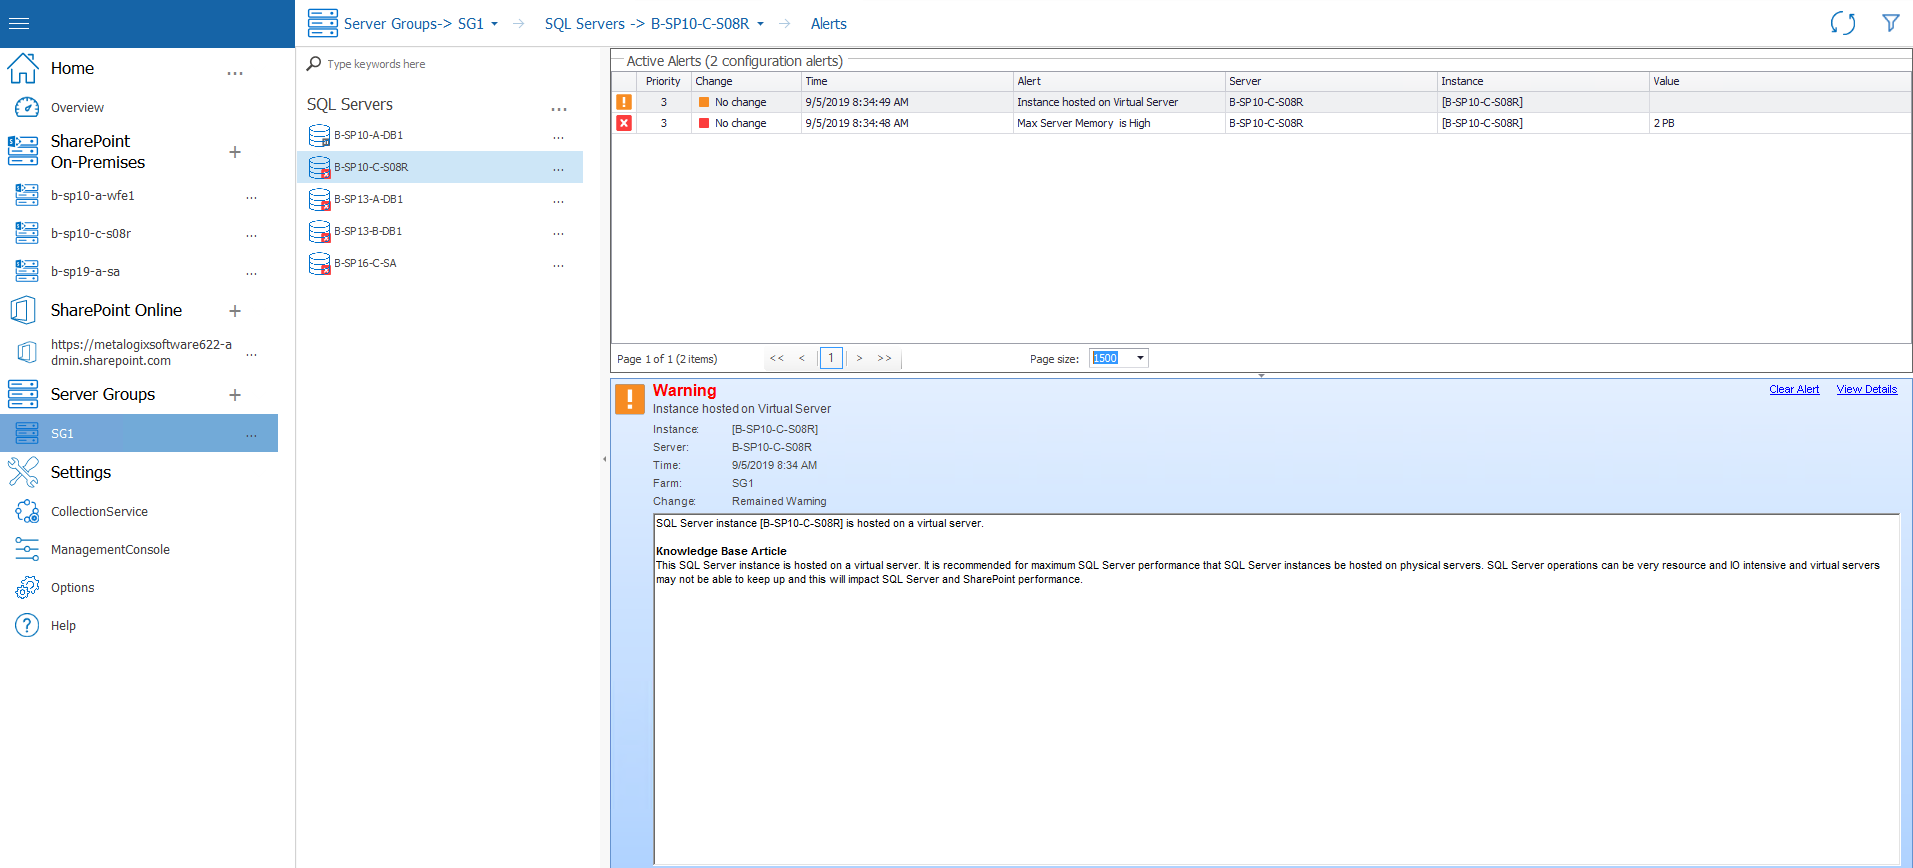
Viewing the Active Alerts for Your SQL Servers
Metalogix Diagnostic Manager provides you with an overall view of the active alerts on all of the SQL Server instances in your farm. You can filter the alerts by using the Filter options, and restrict the results to only a specific type of alert.
To view the active alerts for all of your SQL Server instances
1In the Management Console tree, select the farm whose SQL Servers you want to view.
2Select the name of the farm above the overview pane, this will provide a drop down panel, select SQL Servers.
3Select the name of the sql server for which you would like to see active alerts. Select the name above the overview pane, and from the dropdown panel select Alerts.
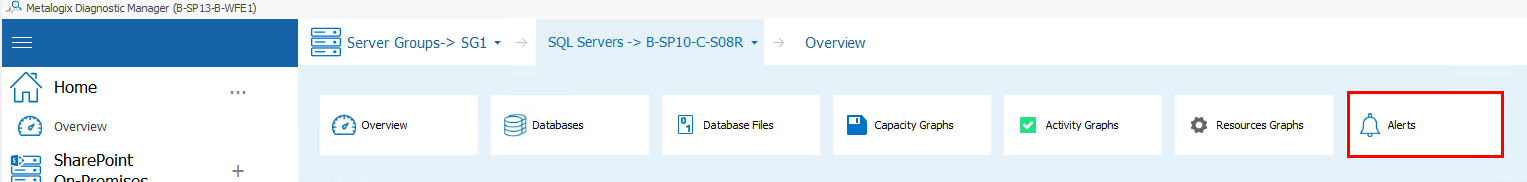
4This will open the Alerts overview page.
See also Using Alerts.