|
For more information about URL transformations, see the topic Setting Rules for Transforming URLs in the Foglight for Application Servers Administration and Configuration Guide or help. | |
|
The amount of time, in seconds, that the trace took to complete. | |
|
HTTP parameters are defined in the recording.config property file. If the single trace is using the specified parameters, information is displayed in the table. Click the HTTP parameter value to view more details in the FxV interface. For more information, see Viewing Request Data in FxV in the Foglight for Application Servers Administration and Configuration Guide. | |
|
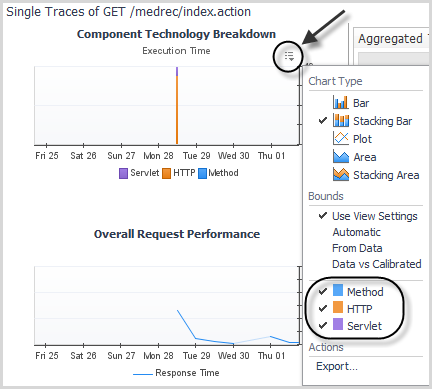
Average execution time spent using the specified technology. | |
There are three types of breakdowns:
Selecting any number of these custom components and tiers displays the average execution time in the Aggregated Traces table and the total execution time for a component technology and tier in the Single Traces table. You can also see breakdowns in chart form for a given request type.
|
1 |
In the Traces view, click the customizer icon |
|
3 |
Click Apply. |