Activity Drill-downs
On the Database home page toolbar, click Activity and select one of the following views:
The Top 20 SQL Statements pane contains the following views:
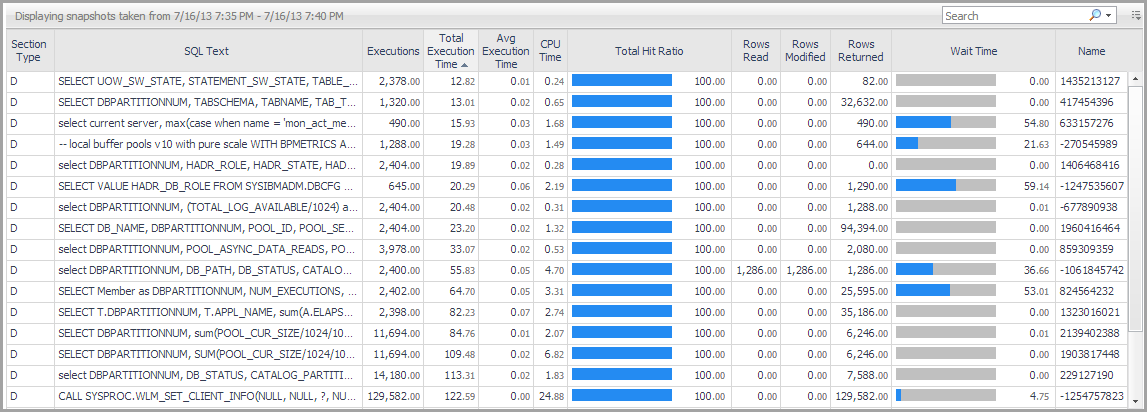
The Top SQL Snapshots view displays the SQL snapshots with the highest activity during the selected time range. This collection gathers the top offensive SQL statements and their associated metrics that exist in the DB2 cache while the collection is running.

For DB2 v9.7.0.1 and later, the Top SQL Snapshots view may display both static and dynamic SQL statements. For other DB2 versions, only dynamic SQL statements are collected and displayed.
On the Database home page toolbar, click Activity and select Top SQL.
This view displays details about a selected SQL snapshot.
This view is located in the lower part of the TOP 20 SQL Statements pane just below the Top SQL Snapshots view.
This view displays details about a selected SQL statement.

From the SQL Snapshots view, click a SQL statement in the SQL Text column.
This view provides the following embedded views:
|
|
Displays details about the selected SQL statement.
NOTE: Switching between Total and Execution allows you to see the totals for all executions versus the average execution metrics. |
|
|
|
• |
Execution Time. The time in milliseconds spent on running the SQL statement. | |
|
|
|
• |
Executions. The number of times the SQL statement was run. | |
|
|
|
|
|
|
• |
Rows Returned. The number of rows that have been selected and returned to the application. If this number is lower than Rows Read, that might indicate that an index is missing. This metric is only available for DB2 v9.7.0.1 and later. | |
|
|
|
|
|
|
• |
Rows Read. The number of rows read from the table needed to process the selected SQL statement. | |
|
|
|
• |
Rows Written. The number of rows inserted, updated, or deleted from the table, and needed to process the selected SQL statement. | |
|
|
|
• |
Sorts Overflows. The total number of sorts associated with the selected SQL statement that ran out of sort heap and likely required disk space for temporary storage. | |
|
|
|
• |
Sorts. The total number of sorts associated with the selected SQL statement that were run. | |
|
|
|
• |
Total Sort Time. The total elapsed time (in milliseconds) for all sorts associated with the selected SQL statement that was run. | |
Provides information about the performance of the tables in the selected database.
By default, the Top Tables pane lists performance metrics for the top 10 tables of the selected database in order of rows read. You can configure the pane to list the top 10, 15, or 20 tables listed in order of rows read, rows written, overflows, or page reorganizations.
Select tables from the list to compare their selected activity metrics on the charts at the bottom of the pane.

On the Database home page toolbar, click Activity and select Top Tables.
|
|
|
|
|
|
• |
Schema. The schema of the monitored table. Used with Table Name, this element can help in determining the source of a contention for resources. | |
|
|
|
• |
Table Type. The type of table for which information is returned. | |
|
|
|
• |
Rows Read. The number of rows in the table that are read from in order to process the selected SQL statement. | |
|
|
|
• |
Table organization. Organization method of the data in the table. 'R' indicates data is row-organized, 'C' indicates column-organized. | |
|
|
|
• |
Number of columns. Number of columns defined for the table as appears in the catalog. | |
|
|
|
• |
Rows Written. The number of rows in the table that are changed (inserted, updated, or deleted) in order to process the selected SQL statement. | |
|
|
|
• |
Overflows. The total number of accesses (reads and writes) to overflowed rows of the table. | |
|
|
|
|
|
|
• |
Avg Num Column Referenced - Avgerage number of column referenced in each access to the table. Availiable from v10.5 and above when the mon_obj_metrics parameter is set to extended. | |
|
|
|
• |
Table scans - The number of scans performed on the table in the selected time frame. Available from version 9.7 and above. | |
|
|
|
• |
Size - Total size of table in pages separated to the various page types: Data, Index, Xda, Lob, Long and Col | |
|
|
|
• |
Page Reorgs. The number of page reorganizations run for the table during the specified time range. | |
|
|
|
• |
Tablespace Id. The integer used by the selected database to uniquely represent this tablespace. | |
|
|
|
• |
Data. The total number of disk pages the table consumes. This number represents the base table size only. Space consumed by index objects, LOB data, and long data is displayed in the Index, Lob, and Long columns, respectively. | |
|
|
|
• |
Index. The total number of disk pages consumed by all indices defined in the table. | |
|
|
|
• |
Lob. The total number of disk pages consumed by LOB data in the table. | |
|
|
|
• |
Long. The total number of disk pages consumed by LONG data in the table. | |
|
|
|
• |
Xda. The total number of disk pages consumed by XML storage object (XDA) data in the table. | |
|
|
|
|
|
|
|
|
|
|
|
|
|
|
|
|
|
Displays the same metrics in chart form. |
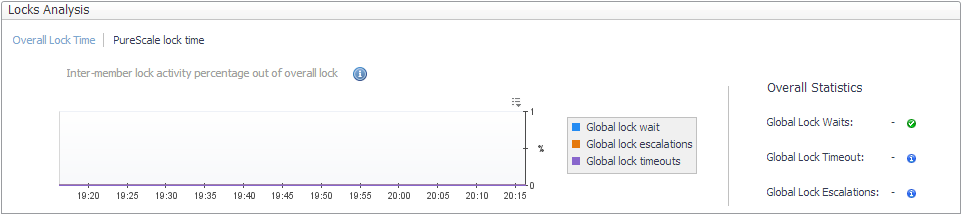
Provides current and historical metrics on locks held in the selected database.
On the Database home page toolbar, click Activity and select Locks.
You can also access the Locks pane for a database from the Databases Dashboard. Click the icon at the far right of the database name cell and selecting Locks from the menu that appears.
This view provides the following embedded views:
Displays a selection of lock metrics from the Current Locks Wait Collection.

Displays the global lock metrics from the CF Locks Collection.
|
|
|
• |
Agent ID. 16-bit counter of a system-wide unique ID for the locked wait application. | |
|
|
|
• |
Member Num. The database member from which the data was retrieved for this row. | |
|
|
|
• |
Lock Mode. Indicates the lock type being held and is used to determine what is the source of the lock contention. | |
|
|
|
• |
Lock Object Type. The object type held by the application that helps determine resource contention. | |
|
|
|
• |
Lock Wait Start Time. Date and time the lock started waiting to receive a lock, that had another application lock it. | |
|
|
|
|
|
|
|
|
|
|
|
|
|
|
|
|
|
|
• |
Appl ID Holding Lock. Application ID of the application holding a lock on the object that the application waits to obtain. | |
|
|
|
|
|
|
• |
Lock Attributes. The attributes of the lock. The text identifier of Y is used if there are no locks. | |
|
|
|
|
|
|
• |
Lock Escalation. Indicates whether a lock request was made as part of a lock escalation. | |
|
|
|
|
|
|
|
|
|
• |
Subsection Number. This number relates to the subsection number in the access plan that can be obtained with db2expln. | |
|
|
|
• |
Data Partition ID. Identifies the data partition for returned information and is only used by partitioned tables. The return information represents a value of -1. | |
The Current Agents pane displays agent workload, agent activity, and CPU usage.

On the Database home page toolbar, click Activity and select Current Agents.
You can also access the Current Agents pane for a database from the Databases Dashboard. Click the icon at the far right of the database name cell and selecting Current Agents from the menu.
This view provides the following embedded views:
|
|
Resource. Lists the agent workload resources. |
|
|
Agent Workload. Displays how much the listed resource uses the agent. |
|
|
BACKUP. Indicates the database is being backed up. |
|
|
COMMIT. Indicates a work unit is committing its database changes. |
|
|
COMP. Reports that the database manager is doing a compilation of a SQL statement or planning a precompiling a plan for the application. |
|
|
CONNECTPEND. Reports that the application has started to connect to the database and the connection request is not finished. |
|
|
CREATE_DB. Tells the user that a database is being created. An agent initiation request has started to create the database, but the request is not complete. |
|
|
DECOUPLED. The agent has been decoupled and no agents are associated with the application running. This state is normal. If the connection is enabled, no dedicated agents exist. Applications can be decoupled on the coordinating partition. In environments that are non-concentrated, applications are not decoupled and a dedicated coordinator agent is always running. |
|
|
DISCONNECTEDPEND. Tells the user that the application is in the process of disconnecting, however a command has not finished execution. An application might have begun the disconnection command. The database manager must disconnect from the database if an application finishes and no disconnection has taken place. |
|
|
INTR. Tells the user that an interruption of a request is taking place. |
|
|
LOAD. Tells the user that an application is doing an expedited loading of data to a database. |
|
|
LOCKWAIT. Data being processed is standing by for a lock. When the lock is received, its status goes back to its previous value. |
|
|
QUIESCE TABLESPACE. A quiesce tablespace request is taking place. |
|
|
RECOMP. A database manager is recompiling or rebinding the application. |
|
|
REMOTERQST. A federating data source is in the process of providing results to the application. |
|
|
RESTART. After a crash, the database is starting back-up and performing a recovery. |
|
|
RESTORE. A backup image of the database is being restored. |
|
|
ROLLBACK. The database is rolling back changes. |
|
|
ROLLBACK SAVEPOINT. The database is rolling back changes to a certain saving point in the database. |
|
|
TEND. Work that belongs to a global transaction has ended. This work has not committed to the preparation phase required by the two-step protocol commitment. |
|
|
THABRT. This work belongs to a global transaction rolled-back based on speculation. |
|
|
THCOMT. This work belongs to a global transaction committed, based on speculation. |
|
|
UOWEXEC. Work is being processed by the database manager upon request. |
|
|
UNLOAD. The database is doing an accelerated unloading of data. |
|
|
UOWEXEC. Requests are being processed by the database manager. |
|
|
UOWWAIT. The application is processing data for the database manager. Tells the user that application code is in the process of running. |
|
|
WAITFOR REMOTE. A partitioned database instance is standing by for a reply from a remote partition. |
|
|
agents/s. The number of active agents per second (Average active sessions). |
|
|
Active. The number of active agents. |
|
|
Inactive. The application is at one of three statuses: Connected, Wait or Decoupled. |
|
|
Count. Displays the number of running agents during the specified time range. |
Displays detailed agent metrics.

|
|
|
|
|
|
|
|
|
|
|
|
|
|
|
|
|
|
|
|
|
|
|
|
|
|
|
|
|
|
• |
CPU. The total CPU time used by database manager agent process. | |
|
|
|
• |
Client PID. The process ID of the client application that made the connection to the database. | |
|
|
|
• |
Coord PID. The process ID (UNIX systems) or thread ID (Windows systems) of the coordinator agent for the application. | |
|
|
|
Displays user-defined metrics tailored to your database monitoring requirements. For procedures on defining user-defined collections, see Adding User-defined Collections.

On the Database home page toolbar, click Activity and select User-defined Collections.
Memory Drill-downs
The Memory drill-down provides access to:
Provides memory summary metrics on the members and memory pools for the selected database.
Select Whole Database or a member within the selected database from the list at the top of the pane.
On the Database home page toolbar, click Memory and select Memory Summary.

|
|
|
• |
DB Memory. Displays the total memory allocated to the selected database. | |
|
|
|
• |
Pool Allocated Size. Displays a breakdown of the total memory allocated to the members of the selected database using a bar chart. | |
|
|
|
• |
Pool Breakdown. Displays a breakdown of the total memory allocated to the members of the selected database using a pie chart. | |
|
|
|
|
• |
Utilization %. The percentage of configured allocated memory that is in use. | |
|
|
|
• |
Allocation. The average allocated size (in KB) of a memory pool. | |
|
|
|
• |
Config Size. The internally configured size (in KB) of a memory pool in the DB2 database system. | |
|
|
|
• |
Alarm. The alarm count and state of the member or memory pool. Click an alarm count to view information about the alarm on the Outstanding Alarms dialog box. For complete information about alarms in Foglight, see the Foglight User Help. | |
Provides performance metrics on the buffer pools for the selected database.

On the Database home page toolbar, click Memory and select Buffer Pools.
This view provides the following embedded views:
The Details tab displays a top-level summary of the buffer pools. The tabs in the lower portion of the view display graphs of the various metrics over time.
|
|
|
|
• |
Total Hit Ratio. A measure of how often a page access (getpage) is satisfied without requiring an I/O operation. | |
|
|
|
• |
Tablespaces. The number of tablespaces using this buffer pool. | |
|
|
|
• |
Data Hit Ratio. A measure of how often a data page access (getpage) is satisfied without requiring an I/O operation. | |
|
|
|
• |
Index Hit Ratio. A measure of how often an index page access (getpage) is satisfied without requiring an I/O operation. | |
|
|
|
• |
XDA Hit Ratio. A measure of how often an XML storage object (XDA) page access (getpage) is satisfied without requiring an I/O operation. | |
|
|
|
• |
pureScale only — GBP Hit Ratio. A measure of how many times a requested page was found in the GBP out of all times it was requested. | |
|
|
|
• |
Col Hit Ratio. A measure of how often a column-organized page access is satisfied without requiring an I/O operation. Available for version 10.5 and above. | |
|
|
|
• |
Read Time. Indicates the total amount of time (in seconds) spent reading in data and index pages from the tablespace containers (physical) for all types of tablespaces. | |
|
|
|
• |
Write Time. Provides the total amount of time spent (in seconds) physically writing data or index pages from the buffer pool to disk. | |
|
|
|
• |
Direct Reads Rate. The number of read operations that do not use the buffer pool, per second. | |
|
|
|
• |
Direct Writes Rate. The number of write operations that do not use the buffer pool, per second. | |
|
|
|
• |
Direct Read Time. The elapsed time (in seconds) required to perform the direct reads. | |
|
|
|
|
|
|
• |
Files Closed. The total number of database files closed. This element can be used to help with determining the best value for the maxfilop configuration parameter. | |
|
|
|
• |
Unread Prefetch Pages. Indicates the number of pages that the prefetcher read in that were never used. If this number is high, prefetchers are causing unnecessary I/O by reading pages into the buffer pool that are not being used. | |
|
|
|
• |
Alarms. The alarm count and state of the member or memory pool. Click an alarm count to view information about the alarm on the Outstanding Alarms dialog box. For complete information about alarms in Foglight, see the Foglight User Help. | |
|
|
|
• |
Size. The current buffer pool size in pages. | |
|
|
|
• |
Col Logical Reads. Indicates the number of column-organized pages requested from the buffer pool (logical) for regular and large table spaces. |
|
|
|
|
• |
Col Logical Reads Rate. Indicates the number of column-organized pages which have been requested from the buffer pool (logical) for regular and large table spaces per second. |
|
|
|
|
• |
Col Physical Reads. Indicates the number of column-organized pages read in from the table space containers (physical) for regular and large table spaces. |
|
|
|
|
• |
Col Physical Reads Rate - Indicates the number of column-organized pages read in from the table space containers (physical) for regular and large table spaces, per second . |
|
|
|
|
• |
Automatic. Indicates whether the buffer pool has self-tuning enabled. 1 indicates self-tuning is enabled for the buffer pool, and 0 otherwise. | |
Displays graphs of read and write metrics for the buffer pools against a baseline.
|
|
|
|
|
|
|
|
|
|
|
|
• |
Data Logical Reads Rate. The number of data logical reads per second, which includes accesses to data pages that are already in the buffer pool when the database manager needs to process the page. Also includes data pages that are read into the buffer pool before the database manager can process the page. | |
|
|
|
• |
Data Physical Reads Rate. The number of data pages read in per second from the tablespace containers (physical) for regular and large tablespaces. | |
|
|
|
• |
Index Logical Reads Rate. The number of index logical reads per second, which includes accesses to index pages that are already in the buffer pool when the database manager needs to process the page. Also includes index pages that are read into the buffer pool before the database manager can process the page. | |
|
|
|
• |
Index Physical Reads Rate. The number of index pages read in per second from the tablespace containers (physical) for regular and large tablespaces. | |
Displays graphs of direct reads and direct writes metrics to the buffer pools. For metric descriptions, see Buffer Pools — Details tab.
Storage Drill-downs
The Storage drill-down provides access to:
Tablespaces
The Tablespaces Pane provides metrics and graphs of the top 10 tablespace activities and summarizes tablespace usage. This pane provides the following views:
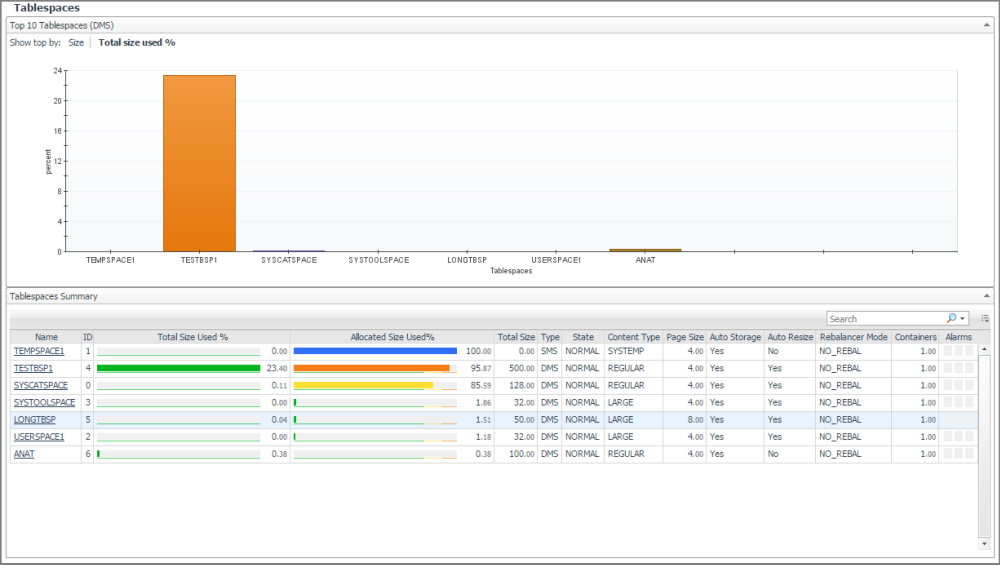
On the Database home page toolbar, click Storage and select Tablespaces.
You can also access the Tablespaces pane for a database from the Databases Dashboard. Click the icon at the far right of the database name cell and selecting Tablespaces from the menu that appears.
Displays the 10 tablespaces which have the highest size or the highest percentage of space utilization, according to the user’s selection. The default selection for sorting graphically is space utilization. Selecting the alternate value updates the chart and the table.

|
|
|
• |
Show top by. Use the Show top by options to select metrics which display graphs for size and percentage of tablespace usage. Click the required metric representation to display the respective graph. |

The following graphs are provided:
|
• |
Size: Tablespace size over the last 30 days or during the timeframe selected (which ever is longer). |
|
• |
% Space Usage. Percent of the tablespace in use. Utilization is calculated after taking into account the type of the tablespace (SMS/DMS), its parameters (like auto extend), the free space on the file system and the IBM architecture size limitations. |
|
|
|
Axis Definitions: |
|
|
|
|
|
|
|
|
|
|
|

|
The Tablespaces Summary view shows the status for all the database tablespaces, including space usage in percent and state of the tablespace.
The Tablespace Summary view is located in the lower part of the Tablespaces pane.
|
|
|
|
|
|
• |
Total Size Used %. Tablespace utilization % including free space on the file sytstem and DB2 architecture limits | |
|
|
|
• |
Alarms. The number of warning, critical, and fatal alarms for this DB2 database tablespace. The dwell shows the most recent alarms raised against this tablespace, sorted by severity. Click this field to view the Alarms list. This list allows browsing through the alarms, which are sorted according to severity. See the Foglight Online Help, Monitoring System-Wide Alarms for details on the alarm information. | |
|
|
|
• |
Auto Resize. Relates to the DMS tablespaces and storage tables stored automatically. A setting of one indicates enablement of the auto resizing. | |
|
|
|
• |
Auto Storage. Describes whether the tablespace was created as an automatic storage tablespace. A value of 1 (Auto) means yes; 0 means no. | |
|
|
|
|
|
|
• |
Content Type. Text identifier defining the size or type of the tablespace: ANY, LARGE, SYSTEMP, or USRTEMP. | |
|
|
|
• |
ID. Numerical identification of the tablespace. | |
|
|
|
• |
Name. The name of the tablespace. Clicking the tablespace name drills down further to the Tablespace-specific page. | |
|
|
|
|
|
|
• |
Rebalancer Mode. Indicates if the current re-balancing process is removing space from a tablespace or adding space to a tablespace. |
|
|
|
|
• |
State. Text identifier of the tablespace state. | |
|
|
|
• |
Total Size. The total amount of allocated space (in megabytes) in this tablespace. | |
|
|
|
• |
Type. Text identifier of DMS or SMS. | |
|
|
|
• |
MAX ARCHITECTURE SIZE TB - Maximum size allowed by DB2 for a tablespace as reported in the DB2 docs. Size is given in TB. -1 indicates limit is not relevant | |
|
|
|
• |
MAX ARCHITECTURE SIZE pages - Maximum size allowed by DB2 for a tablespace as reported in the DB2 docs . Size is given in Mega pages (1 means 1 million pages). -1 indicates limit is not relevant. | |
|
|
|
• |
FS Free Size MB - Total amount of free space left on all file system used by the tablespace. Size is given in MB | |
|
|
Clicking the tablespace name drills down to the Tablespace-specific page.
For more information, see Tablespace-specific Page. |
This page provides details on tablespace properties and space utilization, allowing you to analyze any issues affecting the selected member.

From the Tablespaces pane, click the required tablespace in the Top 10 Tablespaces view or the tablespace name in the Tablespace Summary view.
This pane is made up of the following views.
This view provides the following panes:
|
|
|
• |
Alarms. The number of warning, critical, and fatal alarms for this database tablespace. The dwell shows the most recent alarms raised against this tablespace, sorted by severity. |

Clicking an alarm displays an alarm management pop-up. |
|
|
|
• |
Auto Resize. Relates to the DMS tablespaces and storage tables stored automatically. A setting of 1 indicates enablement of the auto resizing. | |
|
|
|
|
|
|
• |
Content Type. Text identifier defining the size or type of the tablespace: ANY, LARGE, SYSTEMP, or USRTEMP. | |
|
|
|
|
|
|
|
|
|
|
|
|
• |
Prefetch Size. The highest number of pages a pre-fetcher receives from a disk for a given time. If this function is enabled, a value of -1 displays. | |
|
|
|
• |
Rebalancer Mode. Shows the direction of rebalancing and whether this process is adding or removing tablespaces. | |
|
|
|
• |
State. Text identifier of the database state. | |
|
|
|
|
|
|
• |
Type. Text identifier of DMS or SMS. | |
The Tablespace Details view provides the following tabs: