Chat now with support
Chat with Support

Foglight 5.9.2 - Data Model Guide

The Foglight data model Data modeling tutorials Appendix: Groovy scripts Appendix: Internal database schema
acl_class Table acl_entry Table acl_object_identity Table acl_sid Table agent_client_defaults Table agent_config_binder Table agent_dc_manager_schedule_ids Table agent_dc_manager_state Table agent_manager_state Table alarm_alarm Table alarm_annotations Table alarm_loc_msg Table auditing_log Table baseline_config Table baseline_config_properties Table baseline_engine_profile Table baseline_observation_profile Table cartridge_cartridge_relation Table cartridge_components Table cartridge_installed_cartridges Table cartridge_items Table credential_data Table credential_lockbox Table credential_mapping Table credential_mapping_entry Table credential_order Table credential_policy Table current_version Table database_instance_id Table database_version Table derivation_calculation Table derivation_complex_definition Table derivation_definition Table fgl4_migration_agent Table fgl4_migration_data_span Table fgl4_migration_dcm Table fgl4_migration_host Table fgl4_migration_host_mapping Table fgl4_migration_log Table fgl4_migration_server Table incident_affected_objects Table incident_incident Table incident_linked_alarms Table incident_problem_ticket Table incident_problem_tickets Table licensing_licenses Table mgmt_object_size Table mgmt_observation_size Table mgmt_timeslice Table mgmt_timeslice_data_avail Table model_association Table model_property_formula Table model_query_criteria Table obs_binary_* Tables obs_metric_aggregate_* Tables obs_metric_scalar_* Tables obs_string_* Tables pcm_encoded_data Table persistable_config_model Table persistable_script Table persistence_column_mapping Table persistence_db_column Table persistence_db_schema Table persistence_db_table Table persistence_grouping_policy Table persistence_lifecycle Table persistence_lifecycle_period Table persistence_obs_key_purge_age Table persistence_obs_purge Table persistence_obs_purge_age Table persistence_observation_index Table persistence_operation Table persistence_retention_policy Table persistence_rollup_progress Table persistence_rollup_retry Table persistence_storage_config_xml Table persistence_storage_manager Table persistence_timeslice_table Table persistence_topobj_purge_age Table persistence_type_hierarchy Table registry_performance_calendar Table registry_registry_value Table registry_registry_variable Table report_output Table report_schedule Table rule_action_handler Table rule_action_message Table rule_action_registry_reference Table rule_action_variable_reference Table rule_blackout_schedules Table rule_effective_schedules Table rule_expression Table rule_firing_strategy Table rule_messages Table rule_rule Table rule_sev_to_clear_actn_hndlr Table rule_sev_to_fire_actn_hndlr Table rule_severity Table rule_severity_expression Table rule_severity_messages Table schedule_named_schedule Table script_annt Table script_annt_attr Table script_argument Table script_argument_annt Table script_argument_annt_attr Table script_example Table script_return_annt Table script_return_annt_attr Table sec_group Table sec_group_nesting Table sec_group_role_match Table sec_grouprole Table sec_jaas_source Table sec_object Table sec_object_mask Table sec_object_permission Table sec_object_type Table sec_permission Table sec_permission_def Table sec_policy Table sec_resource Table sec_role Table sec_user_alias Table sec_user_obj_permission Table sec_user_res_permission Table sec_usergroup Table sec_userrole Table sec_x_attribute Table sec_x_attribute_value Table tagging_service_mapping Table threshold_bound Table threshold_config Table topology_activity_calendar Table topology_activity_upgrade Table topology_object Table topology_object_history Table topology_property Table topology_property_annotation Table topology_property_history Table topology_property_name Table topology_property_value Table topology_service_state Table topology_type Table topology_type_annotation Table topology_type_history Table upgrade_pending_operations Table wcf_groups_by_cartridges Table wcf_resources Table

How do I delete a model?

Only items from ModelRoots can be deleted.

What are domains?

A domain is a specific technology or part of your environment that you are interested in monitoring and for which data is collected and model instances are built.

The Domains dashboard presents an overview of all domains for which you can collect data. It summarizes the state of all monitored domains and allows you to drill down on a specific domain and investigate problems related to it. For more information about monitoring domains, see the Foglight User Guide.

Example: the Host Model structure

Besides its central importance, the Host Model serves as the prime example for understanding parts of the overall data model.

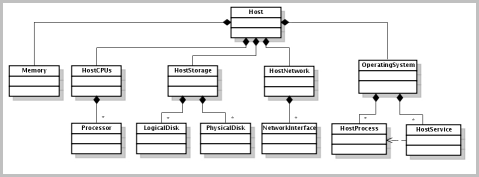
The following diagram illustrates the topology types that are used in the construction of the host model and the arrangements of those types.

The Host type is the root of the model. Instances of this type are identified by the name property which is typically set with the fully qualified domain name of the host.

The Host object contains an aggregate node to group related components. There is a single aggregate node to summarize the state and performance of the host’s memory, processor, storage and network components. The aggregate nodes may then contain other objects to provide a breakdown of the aggregate information.

Agents running on a host are referenced from the corresponding Host object, but do not form part of the host model and do not contribute to the state of the host model itself. That is, there may exist a host that is running an agent that encounters a fatal error. In this case, the Host object in the topology remains in the normal state and references the Agent object that encountered the error. The Host objects only change state because of host-specific rules (for example, CPU utilization).

The common host model can be created from many different sources. One common source is the operating system cartridge, which contains canonical data transformations (CDTs) to create the host model from the data submitted by their agents. This information is transformed via CDTs to produce the physical host model objects and to populate the metrics. Script agents must use CDTs to convert their data into a host model. Another common source is the infrastructure cartridge, which uses the agent manager API to construct the host model directly in Java® code, without requiring a CDT. The host model is also created for virtual machines by the VMware® and Hyper-V® cartridges.

Agents can capture host-related data that cannot be stored on the types defined in the common host model. The host model types must not be sub-typed to add support for this data because the types must be known in order for multiple cartridges to share the model. The host model may be extended through composition by adding instances of cartridge-specific types to the detail collection that is exposed on all host model objects.

The host model defines the following topology types: Host, Memory, HostCPUs, Processor, HostStorage, PhysicalDisk, LogicalDisk, HostNetwork, NetworkInterface, OperatingSystem, HostProcess, and HostService.

There is a single Memory object attached to a host that is identified by that Host instance. The name property of a Memory object is set with the constant string “Memory”.
There is a single HostCPUs instance attached to a Host that provides host level summary metrics for the processors on a host. The HostCPUs instance is identified by the reference to the associated Host object and has its name set with the constant string “CPUs”.
The Processor type is used to represent a logical CPU that is available on the Host.
There is a single HostStorage instance attached to a host that provides host level summary metrics for the logical and physical disks on the host. The HostStorage instance is identified by the reference to the associated Host object and has its name set with the constant string “Storage”.
Some metrics are produced by derived metrics. The disk metrics are calculated based on the values provided for the associated PhysicalDisk objects. The space metrics are calculated based on the values provided for the LogicalDisk objects.
The PhysicalDisk represents a disk that is installed in the machine or configured for a virtual machine.
The LogicalDisk type is used to represent a Windows® partition or Unix® filesystem. These types have the same set of observations.
There is a single HostNetwork instance attached to a host that provides host level summary metrics for the network interfaces on the host. The HostNetwork instance is identified by the reference to the associated Host object and has its name set with the constant string “Network”.
The observations on the HostNetwork type are all produced by derived metrics. These derived metrics calculate the value of a metric from the associated NetworkInterface objects.
The NetworkInterface type is used to represent a network interface that is installed in the machine or configured for a virtual machine.
There is a single instance of the OperatingSystem type attached to a host. The instance is identified by the reference to that Host, and has the following child object types that provide additional details about the operating system (OS):
The HostProcess type captures aggregate metrics for all processes of a given type on the host. The instances complex observation captures the detailed per-process statistics, but that observation may not be produced at all times.
The HostService type captures information on the services configured to run on a Host and their state.

What is a data source?

A data source is a container for a data model. For instance, the Monitoring data source is for modeling monitored objects. It contains the data model. The Dashboards Meta Data source models the Web Component Framework artifacts. Thus, the various data sources model different top-level data collections. Domains such as WebLogic, which are closely bound to the monitoring model, are incorporated in the Monitoring data source.

If you are building dashboards for monitoring purposes, use the Monitoring data source.

The Data Sources dashboard is where you choose a data source. The default (and only current) option is the foglight-5 data source. Click a data source to display its ID, name, and topology and UI query service names.

From the navigation panel, under Dashboards, click Configuration > Data Sources.

Use the icons above the data sources to add , delete , copy , and edit them, and set a default data source.

Related Documents

The document was helpful.

Select Rating

I easily found the information I needed.

Select Rating