Setting up Proxy Configuration
This feature may be disabled by default. To turn it on, click Enable on the Proxy Configuration dashboard. To access this dashboard, from the Administration dashboard, in the Administer Server column, click Proxy.
|
1 |
On the navigation panel, click Dashboards > Administration, and then click Proxy in the Administer Server column. |
|
NOTE: The Administration dashboard has been updated for this release. If you prefer to continue working with the previous version of the dashboard, click Use 5.6 Administration view. This link is located in the lower right corner of the dashboard. |
|
2 |
The Proxy Configuration dashboard opens with the proxy settings disabled by default. |
|
3 |
To add or edit proxy settings, click Edit Proxy Settings. |
|
4 |
In the Proxy Settings Editor dialog box, specify the following fields, as needed: |
|
• |
|
• |
Proxy Server Address: input the host name or IP address of the proxy server. |
|
• |
Proxy Port: input the port number of the proxy server. |
|
• |
Credential Required: indicates whether user authentication is required for the proxy server. |
|
• |
Username: input the user name. This field is available only when the Credential Required field is selected. |
|
• |
Password: input the password. This field is available only when the Credential Required field is selected. |
|
• |
Confirm Password: input the password again to confirm. This field is available only when the Credential Required field is selected. |
|
5 |
(Optional) Click Test Connection to check if the proxy server works. For more information, see To check if the proxy server works:. |
|
6 |
Click Save. The Foglight Management Server refreshes and changes are saved. |
|
1 |
On the navigation panel, click Dashboards > Administration, and then click Proxy in the Administer Server column. |
|
NOTE: The Administration dashboard has been updated for this release. If you prefer to continue working with the previous version of the dashboard, click Use 5.6 Administration view. This link is located in the lower right corner of the dashboard. |
|
2 |
The Proxy Configuration dashboard opens with the proxy settings disabled by default. |
|
3 |
To test the proxy connection, click Test Proxy Connection. |
|
4 |
In the Test Proxy Connection dialog box, input an available URL, as needed. |
|
5 |
Click Test. The Foglight Management Server checks the proxy connection in the background and returns the test result accordingly. |
Enabling Automatic Communication with Quest
The Foglight® Management Server can communicate with Foglight to check for important updates and to send usage data to Quest. Enabling this setting also allows usage data to be sent to Quest including visited dashboards, unique ID of Management Server, Server version and configuration details. This information is then displayed on the Automatic Communication with Quest dashboard or can be viewed in a popup by hovering over the Update link on the Administration page.
When this setting is enabled, you will receive messages:
Notifications are sent to users with the Administrator role. By default, this feature is turned on. To turn it off, from the Automatic Communication with Quest dashboard, click Disable next to the Communication with Foglight.com to part. To access the Automatic Communication with Quest dashboard, from the Administration dashboard, in the Support column, click Support Notifications.
|
• |
Click Enable under the Data Protection Portal Integration part on the Automatic Communication with Quest dashboard. |
|
• |
Click Yes in the prompted Data Protection Portal Integration dialog box when starting up the Foglight Management Server after installation. |
If you need more information about how to set up the connection with this portal or see the Last Connection Status: Connection failed. message under the Data Protection Portal Integration part, refer to Setting up Proxy Configuration .
Extending Your Monitoring Reach with Foglight Cartridges
Each Foglight® cartridge contains extensions for monitoring a specific environment, such as applications, operating systems, or database management systems. Cartridges are installed on the server. A cartridge can contain one or more agents that are used to collect data from monitored environments.
The Management Server includes the Cartridge Inventory dashboard, which contains controls for installing, enabling, disabling, and uninstalling cartridges, and for viewing information about the installed cartridges. To access this dashboard, from the navigation panel, click Dashboards > Administration > Cartridges > Cartridge Inventory.
Some cartridges include additional components, such as agent installers or additional configuration files. After cartridge installation, these components are available for download from the Foglight Management Server using the Components For Download dashboard. To access this dashboard, from the navigation panel, click Dashboards > Administration. On the Administration dashboard, click Component Download in the Cartridges column.
For more information, see the following topics:
Configuring Foglight Agents for Host Monitoring
Foglight® agents collect data from monitored environments and send it to the Management Server. Each agent type can monitor a specific part of your environment, such as an operating system, application, or server. Foglight cartridges that you install on the server include one or more agent types. Foglight also includes internal agents that monitor Foglight components and services.
After installing and enabling a cartridge, and downloading remaining cartridge components, deploy its agent package to each host running an Agent Manager that you want to monitor. After deployment, create an agent instance for each monitored host, edit the agent’s properties, and start its data collection. See the Installation and Setup Guide set for information on installing the Agent Manager on the hosts that you want to monitor.
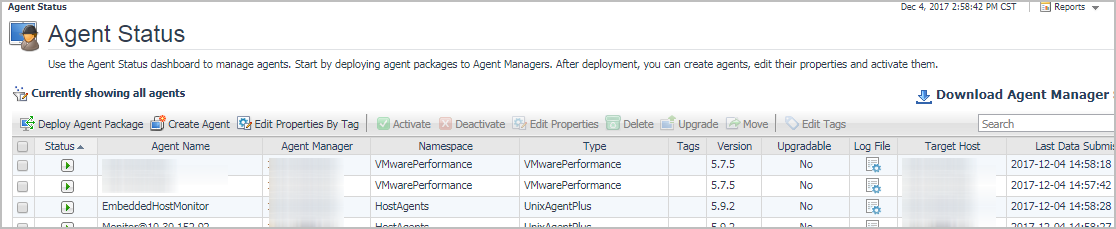
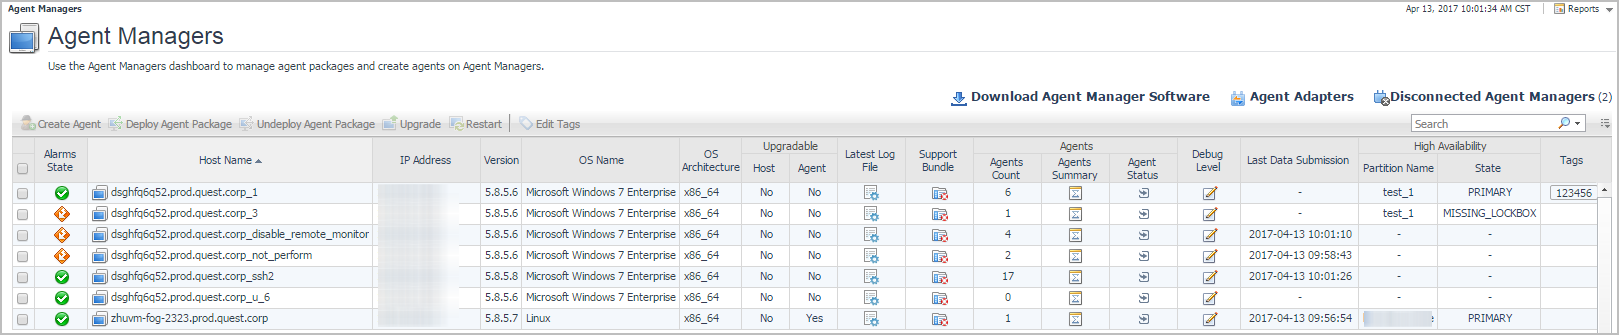
There are two dashboards that allow you to deploy agent packages and create agent instances: Agent Status and Agent Managers. To access the Agent Managers dashboard, from the navigation panel, click Dashboards > Administration > Agents > Agent Managers.
To access the Agent Status dashboard, from the navigation panel, click Dashboards > Administration > Agents > Status.