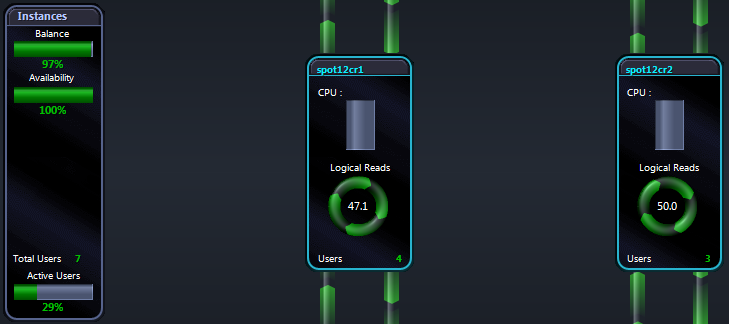
Instances panel
The Instances panel displays information about the database instances within the Oracle RAC cluster.
| Metric | Description |
|---|---|
|
Balance |
A clustered configuration helps provide a distributed workload across all instances in the cluster. A balanced environment indicates that resource usage is shared across all instances, with no one instance overloaded. Balance is calculated as a percentage from 0% (unbalanced) to 100% (fully balanced) and is based on a statistical comparison of 30 samples from a chosen metric. You can choose the metric used — logical reads, physical writes, or CPU usage — from the Spotlight on Oracle RAC Options window. |
|
Availability |
An Oracle RAC implementation consists of several instances and components, and in any configuration certain components or instances are more likely to fail than others. The Availability is the percentage of successful Oracle connections made to the instances in the Oracle RAC cluster. For example, where Spotlight can connect to only three Oracle instances in a four-instance cluster, the calculated availability is 75%. Note: Connection to the operating system or to ASM (Automatic Storage Management) is NOT used to calculate availability. |
| Instances |
If the number of individual instance panels for the cluster exceeds the amount of space available to show them then Spotlight arranges the panels into display pages. Click a button to display the corresponding instance panels. |
| Total Users | The total number of user sessions on all instances in the Oracle RAC cluster. This includes both active and inactive sessions. |
| Active Users | The number of active user sessions as a percentage of the total number of ALL sessions connected to the instances in the Oracle RAC cluster. |
A Panel for each instance
On the Spotlight on Oracle RAC home page, there is an Instance panel for EACH active instance in the cluster under diagnosis.
| Metric | Description |
|---|---|
| Instance name |
The name of this instance within the Oracle RAC cluster. The color of the text indicates its current status. GREEN indicates that the connection has been successfully established. RED indicates that the instance either is not accessible because a connection has not be established, or that it has raised an alarm because of user activity on the instance. Hover the mouse pointer over the name of the instance to view the connection details for this instance, and also view a list of current Spotlight alarms for the instance. To view more information, open a Spotlight on Oracle connection to this instance. |
| CPU |
The CPU usage reported by the operating system for the specified instance in the Oracle RAC cluster. (Most nodes in the cluster run both Oracle and non-Oracle processes, and because all processes consume CPU cycles, the tuning of non-Oracle factors can also improve Oracle performance in the cluster.) Note: Oracle statistics report only CPU utilization by Oracle sessions, but the CPU percentage reported by Spotlight on Oracle RAC covers both Oracle and non-Oracle processes. Because Oracle uses the CPU during several of its operations, extensive CPU usage by a few processes may cause a performance bottleneck that prevents other regular processes from using the CPU. Such processes should be identifed and tuned to avoid the bottleneck. For example, when Oracle executes a SQL statement, it parses the statement to determine whether its syntax and contents are correct. This process can cause significant overhead and consume CPU. Once a statement has been parsed, Oracle does not parse the statement again unless the parsing information is aged from the memory cache and is no longer available. Ineffective memory-sharing among SQL statements – including insufficient shared pool size and the non-use of bind variables – is a major cause of frequent reparsing. Oracle processes also consume significant CPU when they perform high levels of logical I/O (LIO). Wherever possible, you should tune SQL statements to avoid high LIO. (For more information, see the popup help for Logical Reads on the Spotlight on Oracle RAC home page.) |
| Logical Reads |
The rate of Logical I/O (LIO) performed by the current instance in the Oracle RAC cluster. LIO occurs when Oracle finds data in the local buffer cache of an instance without needing to read the data from physical disk. Reading data from the buffer is less expensive than reading it from disk, but still the cost of LIO in an Oracle environment cannot be ignored. Oracle's architecture depends on underlying operating systems for several of its operations, including performing an LIO. To read a block from buffer, Oracle requires that a lock be placed on the row. To obtain a lock, Oracle requires a latch, for which it depends on the operating system. When the operating system has no available latches (because other processes have taken them), the Oracle process has to sleep for a while before it can acquire one. This entire operation means that the LIO operation in an Oracle architecture is not cheap. |
| Users | The current number of user sessions on the specified instance in the Oracle RAC cluster. |
Data Flows
| Data Flow | Description |
|---|---|
| Blocks/sec to interconnect | The rate at which blocks are being sent from the current instance to other instances across the cluster interconnect. |
| Blocks/sec from interconnect | The rate at which blocks are being received across the cluster interconnect from other instances. |
| Blocks/sec sent to I/O subsystem | Rate at which blocks are being sent from the current node to the cluster's I/O subsystem. |
| Blocks/sec received from I/O subsystem | Rate at which blocks are being received from the I/O subsystem by the current cluster node. |
Oracle alarms on Instance panels
Three types of alarms can be displayed on the Spotlight on Oracle RAC home page:
|
Oracle alarms |
This type of alarm is displayed on an Instance panel when one or more problems affect an Oracle instance but not NECESSARILY the cluster as a whole.
|
|
Oracle RAC alarms |
These alarms relate specifically to the cluster as a whole, and are NOT displayed on Instance panels. |
|
Aggregated alarms |
Spotlight reports an aggregated alarm if a problem in a single Oracle instance affects the operation of the whole cluster – or if it is repeated in multiple instances so that the combined effect is significant. Aggregated alarms are displayed usually in the Interconnect and Global Status or IO Subsystem panels. |
