Chat now with support
Chat with Support

Spotlight on Oracle 10.5 - Getting Started Guide

Welcome to Spotlight Install Spotlight Start Spotlight Spotlight on Oracle Spotlight on Oracle Data Guard Spotlight on Oracle RAC Spotlight on Unix Spotlight on Windows Spotlight on MySQL Troubleshooting: Connection Problems

Server Processes Panel


The Server Processes panel indicates the status of Oracle server processes that perform database activities on behalf of end users, and mediate database connections:

Panel Components

PGA Target

A program global area (PGA) is a memory region that contains data and control information for a server process. It is an area of non-shared memory created by Oracle when a server process is started. Access to the PGA is exclusive to that server process and is read and written only by Oracle code acting on behalf of the process.

The total PGA memory allocated by each server process attached to an Oracle instance is also referred to as the aggregated PGA memory allocated by the instance.

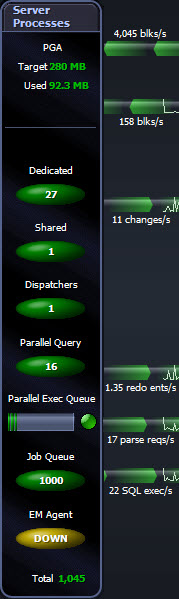
Here the value represents the PGA aggregate target given by initialization parameter PGA_AGGREGATE_TARGET. This is a global target for the Oracle instance, and Oracle tries to ensure that the total amount of PGA memory allocated across all database server processes never exceeds this target.

When PGA_AGGREGATE_TARGET is used, the sizing of work areas for all dedicated sessions is automatic and all *_AREA_SIZE parameters are ignored for these sessions. For shared servers, you still need to control the aggregate PGA memory by using *_AREA_SIZE parameters.

PGA Used The total amount of PGA (Program Global Area) currently in use by all active sessions. This value represents the "total PGA in use" statistic in V$PGASTAT.
Dedicated Dedicated server processes perform work on behalf of a single client process. The number of servers varies as users log into and out of the database.
Shared The number of shared or multi-threaded servers (MTS) that perform work on behalf of more than one client process. The number of shared servers varies depending on load between the values of the configuration parameters MTS_SERVERS and MTS_MAX_SERVERS. If a high proportion of MTS are busy, then the Multi-threaded Server Alarm becomes active. For advice on how to deal with this alarm, see Deal With MTS Contention.
Dispatchers

MTS dispatchers that coordinate the allocation of shared servers to client tasks. The number of dispatchers varies depending on the load between the values of the configuration parameters DISPATCHERS and MAX_DISPATCHERS. If a high proportion of MTS dispatchers become busy, then an alarm may become current on this component. For more information about this alarm, see Deal With MTS Contention.

Parallel Query

Parallel query servers support parallel execution of queries and DML statements. The number of servers varies depending on load between the configuration parameters PARALLEL_MIN_SERVERS and PARALLEL_MAX_SERVERS. If a high proportion of parallel servers become busy, then a Parallel query server alarm becomes current on this component. Parallel Query Server Alarms

Note: If this is a node in an Oracle RAC cluster, then an inflated number of busy parallel query servers may be reported due to PZnn processes that are spawned by Oracle to do queries on GV$ views.

Parallel Exec Queue

Note: Applies only to Oracle 11g Release 2.

The current length of the Parallel Execution Queue. Each bar represents a session waiting in the queue.

This data is taken from V$WAIT_CHAINS for the following wait events:

  • enq: JX - SQL statement queue
  • PX Queuing: statement queue

See Optimize Necessary Table ScansUse the Parallel Query option for more information.

Job Queue

Job queue server processes that run PL/SQL commands submitted to the Oracle job queue via the DBMS_JOB package. The number of job queue processes is determined by the configuration parameter JOB_QUEUE_PROCESSES. If a high proportion of job queue servers become busy, then the Job Processes Busy Alarm becomes current on this component.

EM Agent

The status of the connection between Oracle Enterprise Manager (OEM) and the database under investigation.

OEM is a Web-based database administration and monitoring tool that manages Oracle components and administers Oracle databases. When installed and active, OEM communicates with the databases it administers via a set of EM agent processes under the automated DBSNMP user account.

See also: Agent Status Alarm | Collection Status AlarmFiles Pending Upload Alarm | Status Error AlarmOEM Status PageOEM Logs Page.

Total The total number of server processes that are currently active.

Data Flows

Physical Reads Direct/s

The rate (in blocks/s) at which data is read directly from disk, bypassing the buffer cache.

Direct reads maximize transfer rates for data-intensive I/O operations such as parallel queries and disk sorts.

Spotlight raises the Temporary IO Wait Ratio Alarm when the time spent in temporary I/O waits is too high as a percentage of the time spent performing user calls on the Oracle database.

Logical Reads/s

The rate at which blocks are read from the SGA (System Global Area) by all server processes.

The Continued Fetch Rate Alarm becomes active when the rate at which Oracle migrates rows to new blocks exceeds a threshold.

Block Changes/s The rate at which changes are made to blocks in the SGA by all server processes. The Lock Wait Alarm becomes current on this component if updates are being blocked by locks.
Redo Buffer Entries/s The rate of redo buffer entries made by all server processes.
Parse Requests/s The rate of SQL parse requests per second by all server processes. The Total Parse Wait Time Ratio Alarm or Parse Ratio Alarm becomes current if the ratio of parse requests to execute requests exceeds a threshold.
SQL Execution Rate The rate of SQL execution requests per second by all server processes.


Related Topics

Related Documents

The document was helpful.

Select Rating

I easily found the information I needed.

Select Rating