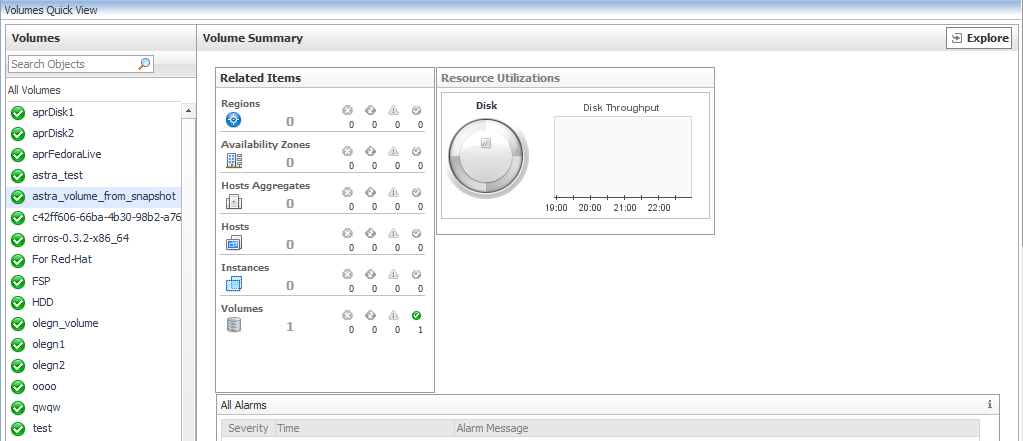
When you click the Volumes tab, a list of all volumes is displayed, with the default selection being All Volumes. The Summary — All Volumes frame displays a list of relevant alarms and a summary of the top disk consumers.
Click the Explore link in the upper right of the Quick View to view detailed information about the selected Instance.
Clicking an object type in the Related Items view displays a list of related objects of that type along with their statuses.
|
3 |
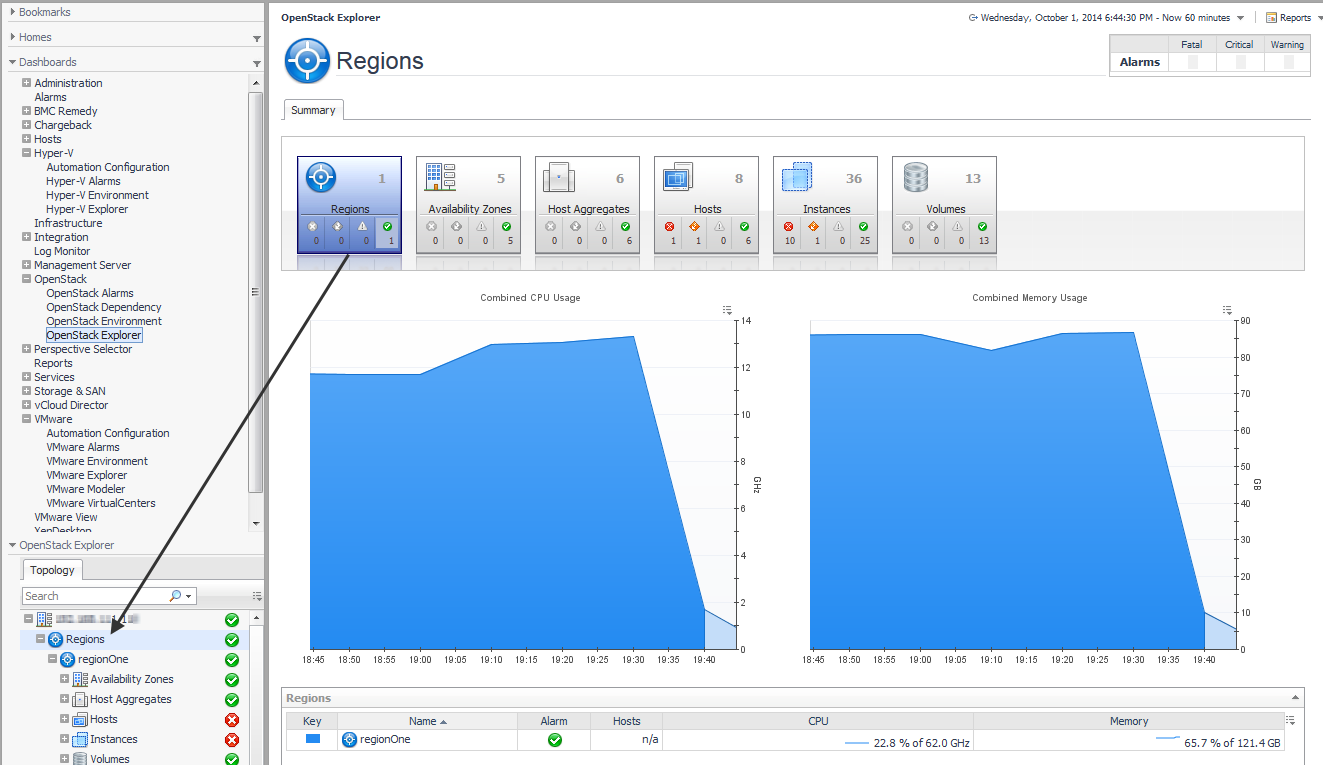
Click Dashboards > OpenStack > OpenStack Explorer. |
The OpenStack Explorer dashboard contains the following views: The Topology tab located in the navigation panel and the OpenStack Explorer display area. The tabs available on each view in the display area depends on the resource object or group of resource objects selected on the Topology tab. The Summary tab appears on all views.
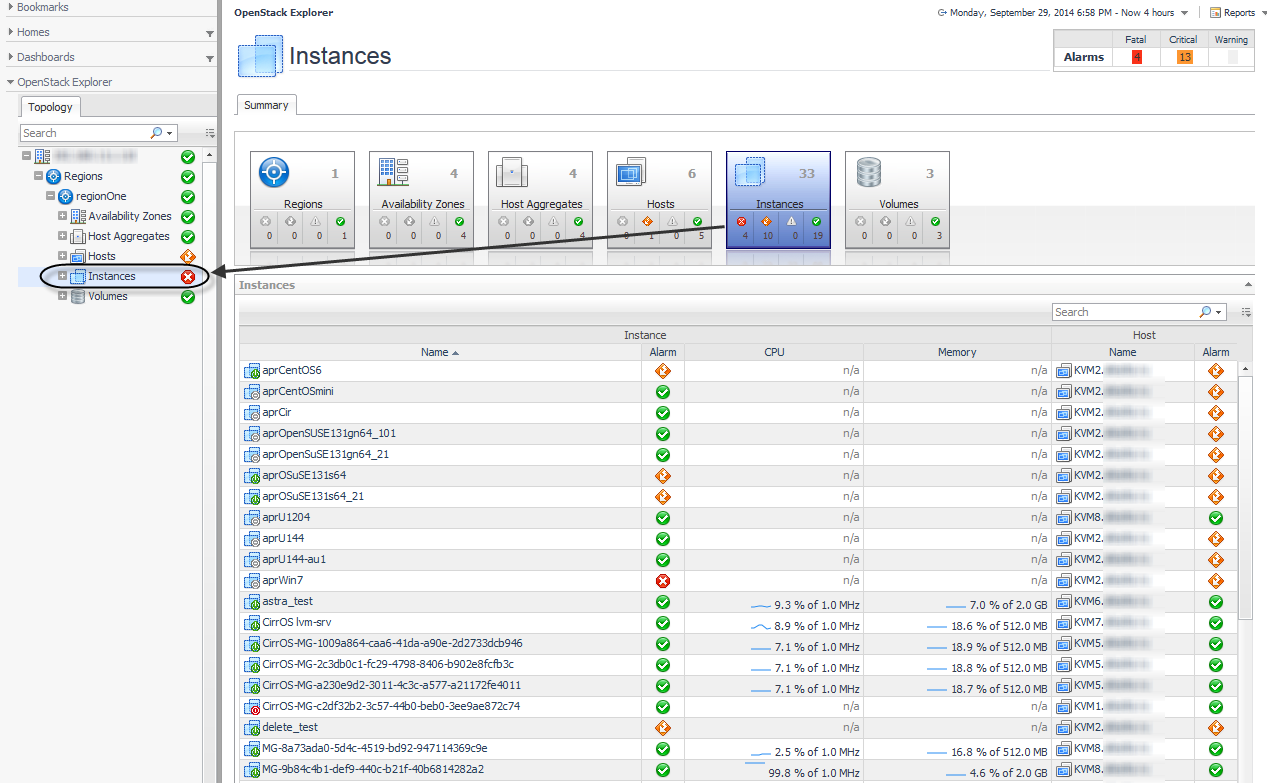
The OpenStack Explorer topology view is located in the navigation panel below the Dashboards. The navigation tree on the Topology tab represents the various OpenStack infrastructure objects: Regions, Availability Zones, Host Aggregates, Hosts, Instances, and Volumes.
All OpenStack Explorer views contain a Summary tab with Foglight tiles that indicate the type of the selected object or objects, and the related alarm counts.
For example, if you select Regions from the Topology view, the Summary tab displays graphs and a table representative of all the configured regions.
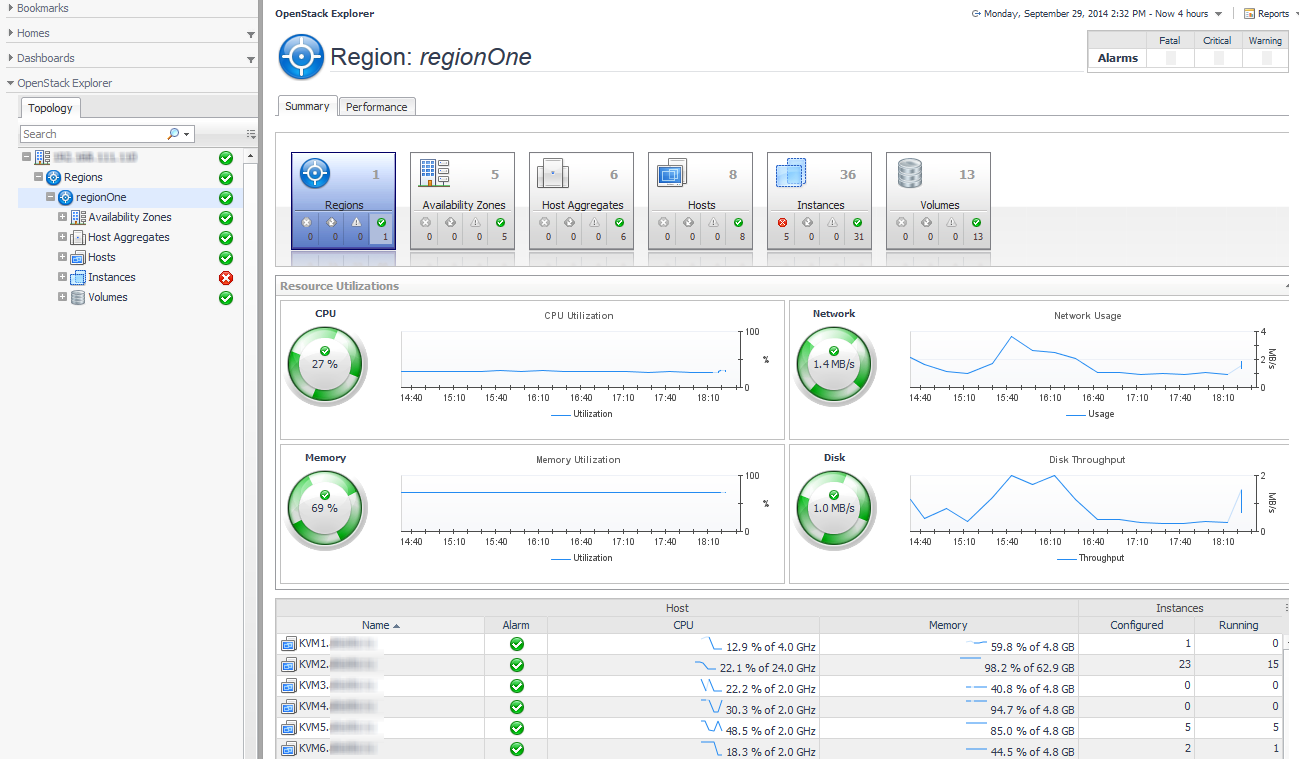
Drilling down and selecting an individual region from the Topology tree displays a Summary tab and a Performance tab.
For reference information about the tabs and data appearing on the various OpenStack Explorer views, see OpenStack Explorer Dashboard View .