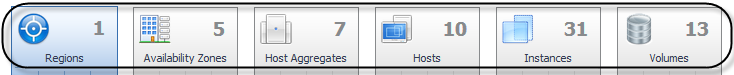
Clicking the label in the tile, for example, Availability Zones, displays summary and alarm information for all components of that type in the Quick View area.
For more information, see these topics:
Foglight for OpenStack relies on Foglight Agents to collect data from monitored hosts, using a desired collection method. Prior to creating Foglight Agents, it is critical to properly configure the OpenStack environment for monitoring. For more information, see Preparing your OpenStack environment for monitoring .
The Administration tab of the OpenStack Environment dashboard lists the available Foglight Agents with their status. You can create agents and modify their properties here. For more information, see Administration tab .
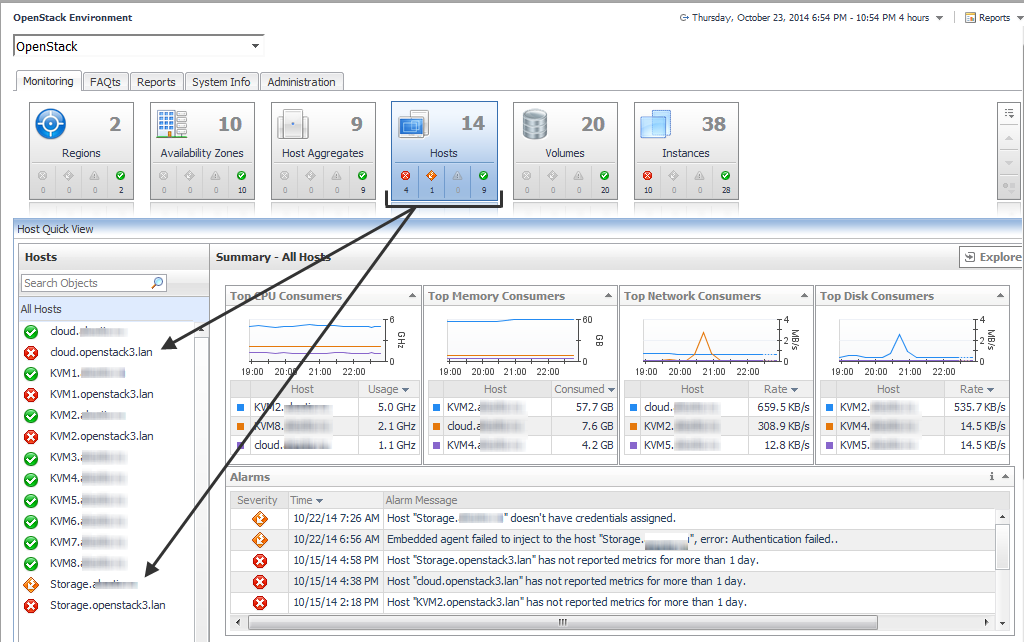
In the navigation panel, under Dashboards, click OpenStack Environment to go to the OpenStack Environment dashboard. For more information about this dashboard and the associated views, see Using the OpenStack Environment dashboard .
To see in-depth details about an OpenStack cloud infrastructure resource, use the OpenStack Explorer dashboard. You can drill down for details from using the OpenStack Explorer Topology view in the navigation panel. For more information, see Using the OpenStack Explorer dashboard .
Prior to creating Foglight Agents, configure the servers that you want to monitor.
The following requirements must be met before the Foglight Agents can successfully collect data:
|
• |
|
• |
For Linux® instances: |
|
• |
For Windows® instances: |