Changing SCM Services Configuration and Settings
You can change the following SCM Services Configuration and Settings from the SCM Services Setup application.
IMPORTANT: After making any changes, remember to click [OK] to save them.
General Options
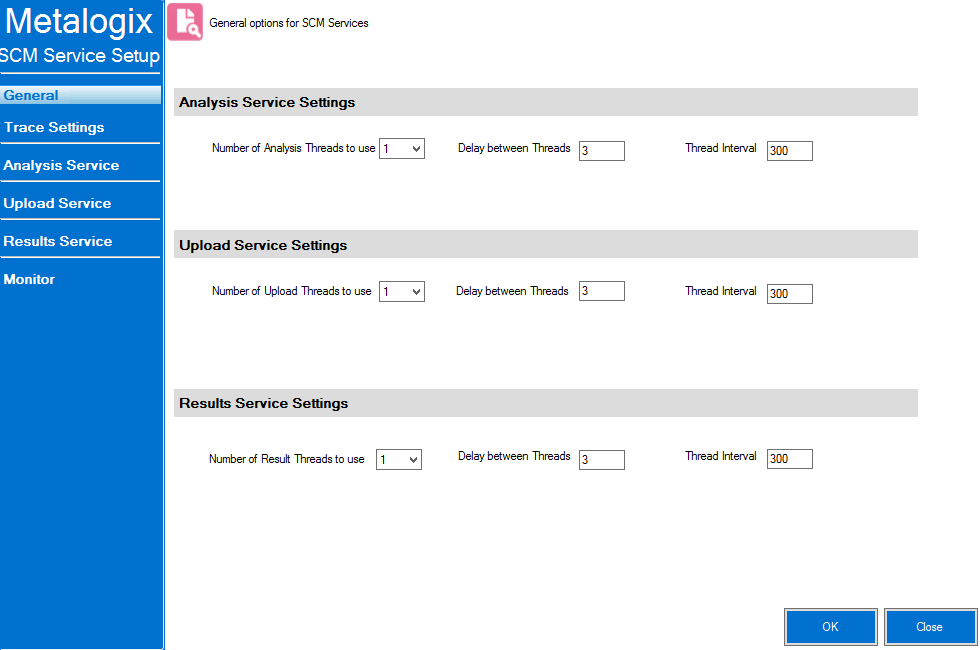
For Analysis Service Settings, Upload Service Settings, and Results Service Settings, you can adjust the number of threads used, the time delay between threads (in seconds) and the intervals (in seconds) at which each thread "wakes up" to check for files to be uploaded to and results to be downloaded from Sensitive Content Manager.
NOTE: The default values for these settings should be acceptable for most Sensitive Content Manager analysis jobs. However, you may want to adjust them if, for example, you are processing an exceptionally large number of large files and have sufficient system resources to handle multiple (up to four) threads. Be aware, however, that if you increase the number of threads and decrease the delay and/or thread interval, you may significantly increase the size of the log file(s).

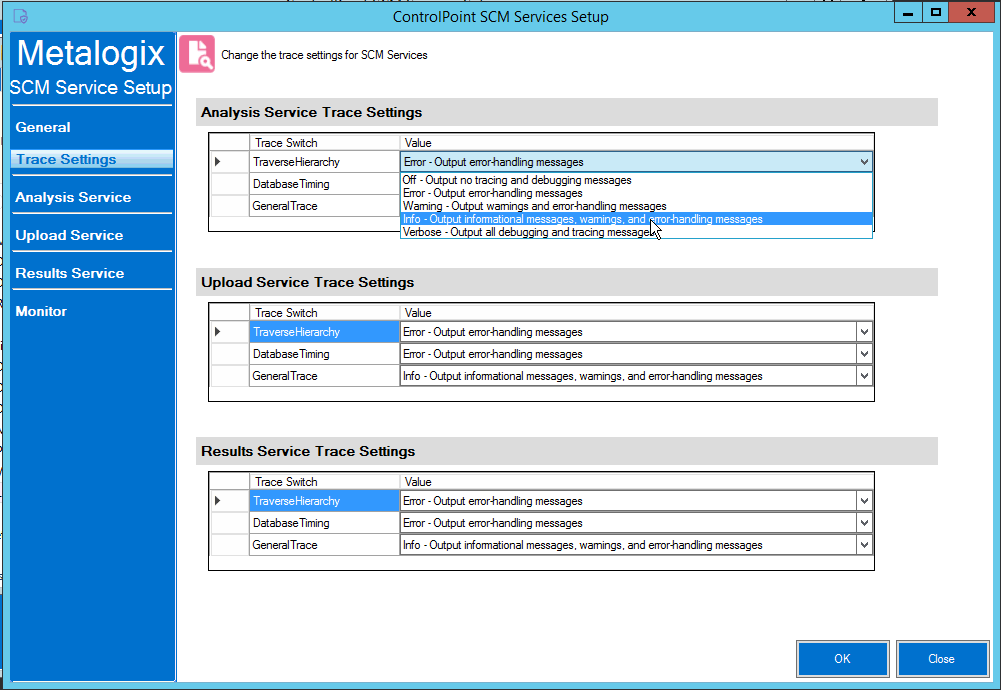
You can use the Trace Settings drop-downs to change the level of logging for components of each SCM Service.
Monitoring the Status of ControlPoint Interactions with SCM
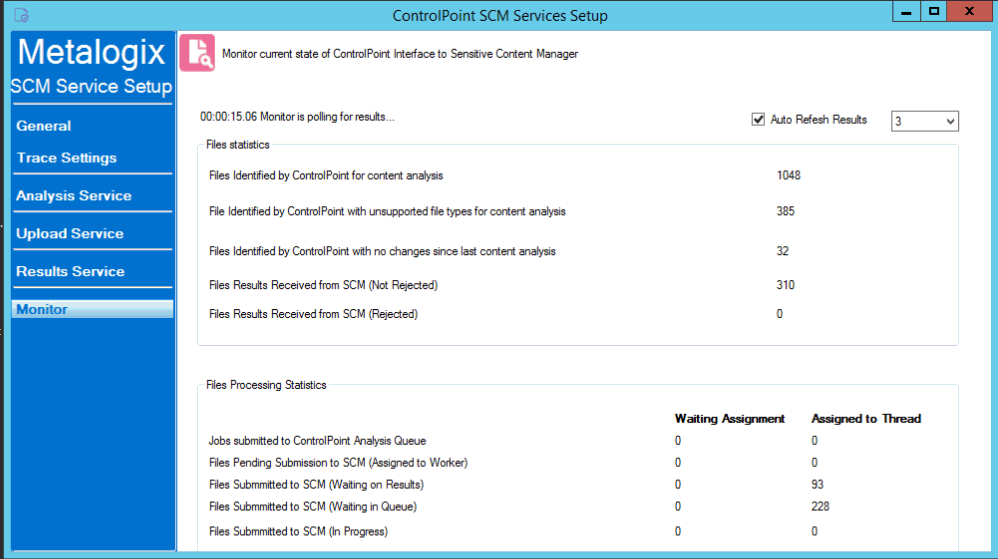
You can monitor the progress of active file scans via the SCM Services Setup - Monitor tab. You can also choose to Auto Refresh the monitor at a rate of anywhere from 1 to 5 seconds.
When all active jobs have been processed, Files Processing Statistics are reset to 0.
Viewing SCM Job Detail
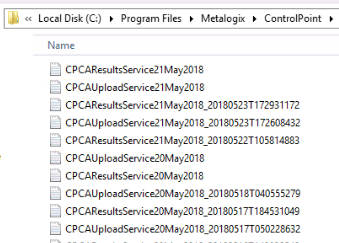
You can view the details of ControlPoint SCM Upload Service and Results Service activity in the applicable log file, located in the folder where SCM Service files reside (by default, C:\Program Files\Metalogix\ControlPoint Online\ControlPointFeatures\Services\ContentAnalysis. At a minimum, a new log is created each week (with the date that the log was created appended to the file name). Once a log file exceeds 10KB, however, a new log is created with both a date and time stamp.
The level of detail recorded in the log depends on the SCM Trace Switch values. The size of the log file is also influenced by General Options.
Setting Sensitive Content Manager End Points and Managing Scanning Preferences
ControlPoint Application Administrators use the ControlPoint Sensitive Content Manager Configuration dialog to set EndPoints to point to the server(s) on which Sensitive Content Manager is configured. Members of the Compliance Administrators group can also test the availability of each EndPoint and change default preferences for scanning content.
NOTE: ControlPoint Application Administrators can also configure EndPoints individually and update other configuration settings via ControlPoint Configuration Settings - Compliance settings.
To launch the ControlPoint Sensitive Content Manager Configuration dialog:
From the left navigation Manage tab, choose Compliance > Sensitive Content Configuration Maintenance.
Setting EndPoints
The Value of each Sensitive Content Manager EndPoint must be set to point to the server(s) on which Sensitive Content Manager is configured your environment. Use the information in the following table for guidance.
|
Endpoint |
Description |
Value |
|---|---|---|
|
Sensitive Content Manager Upload EndPoint |
The URL for the Sensitive Content Manager for sending files. This corresponds to the File Upload URL specified at the time Sensitive Content Manager was installed. |
http://<server.domain> (or if installed on multiple servers: |
|
Sensitive Content Manager Results EndPoint |
The URL for the Sensitive Content Manager service for retrieving files job results. This corresponds to the Results Service URL specified at the time Sensitive Content Manager was installed. |
http://<server.domain> (or if installed on multiple servers: |
|
Sensitive Content Manager Profile EndPoint |
The URL for the Sensitive Manager service for retrieving profiles. This corresponds to the Profile Service URL specified at the time Sensitive Content Manager was installed. |
http://<server.domain> (or if installed on multiple servers: |
|
Sensitive Content Manager Search Terms |
The URL for the Sensitive Content Manager service for retrieving rules used to identify a specific kind of sensitive content. This corresponds to the Subquestion Service URL specified at the time Sensitive Content Manager was installed. |
http://<server.domain> (or if installed on multiple servers: |
When you have finished setting EndPoints, click [Update].
Testing Availability of EndPoints, File Upload, and Results
From the EndPoint Testing tab, you can test the availability of each endpoint that you set, as well as whether files can be uploaded to/received from Metalogix Sensitive Content Manager.
If you click a [Test EndPoint] button and the status returns as Unavailable, make sure that the URL is correct and that the service is available on the Metalogix Sensitive Content Manager server side.
If you click [Test File Upload], ControlPoint will send a sample file to Metalogix Sensitive Content Manager, and will display a log of the action. If you then click [Test File Results], ControlPoint will log the progress of the file's return.
Managing Scanning Preferences
ControlPoint can create columns called Scan Results and/or Terms Detected. Each time a scan is performed, the Severity Level is populated for the scanned item.
ControlPoint Application Administrators can allow this column to be created/populated by changing the value(s) of Automatically add Scan File Results column and update with severity level in SharePoint Lists and/or Automatically Add Terms Detected column and update with severity level in SharePoint Lists from false to true.


