
Activity
This section describes the information that is collected about the system. The following topics are described in this chapter:
·Logs
Services Health
The Services Health page presents information about the servers, services and service status that comprise a standalone or distributed SCM deployment in your organization.
In this topic
Steps to view the Services Health page
About the Services Health page
Steps to view the Services Health page
1.From the navigation panel, expand ACTIVITY and then click SERVICES HEALTH. The Services Health page opens.

About the Services Health page
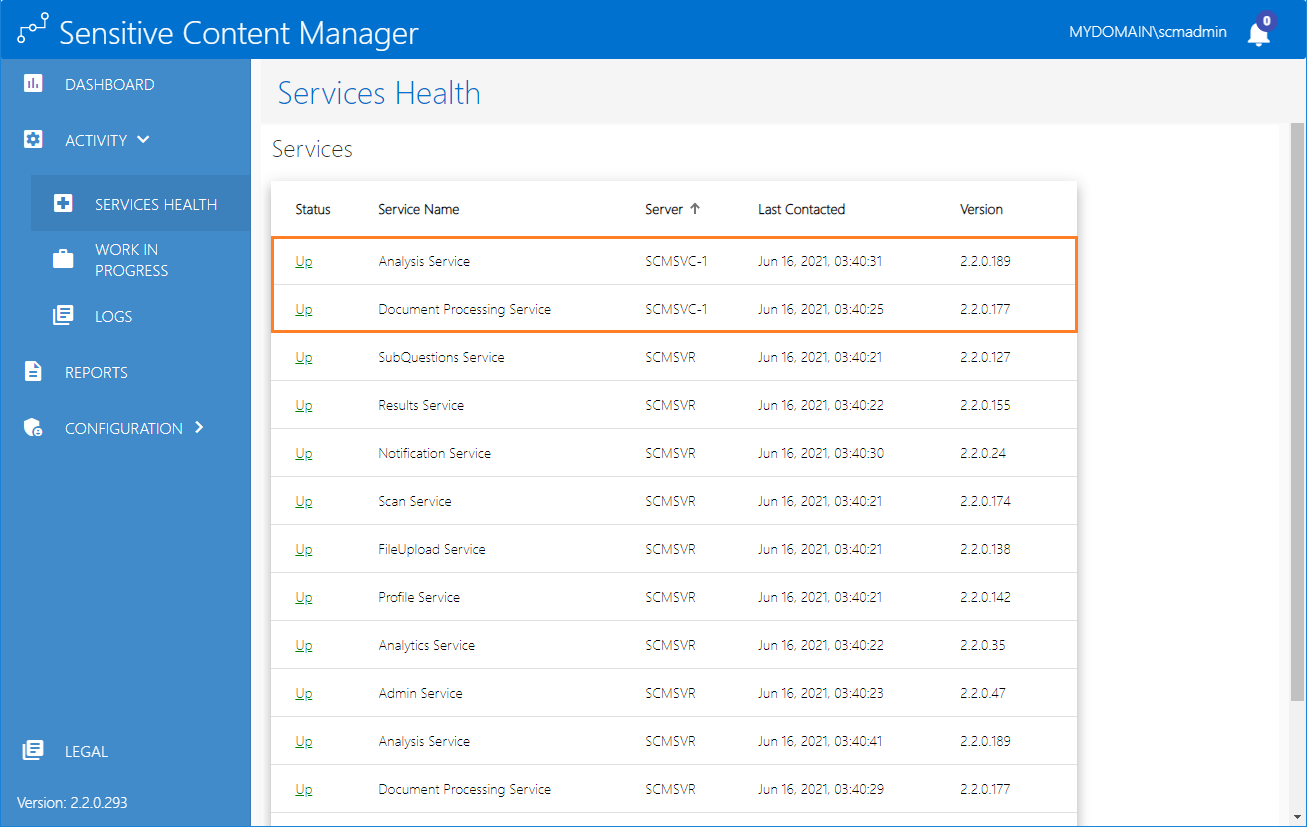
The Services Health page presents a snapshot of the overall health of the system. It is frequently updated with the latest status from the SCM repository. This section displays the following information about the SCM services.
a.Status - indicates the health of the service. The two possible values are: Up and Down. Click the status link to view details about the service. For the Analysis Service and the Document Processing Service, the details also include the set of documents that are currently being processed.
b.Service Name - name of the service.
c.Server - name of the server where the service is installed.
d.Last Contacted - most recent date and time when the service published health information.
e.Version - the version of the service that is installed on the server.
In a distributed environment, additional servers that are deployed to host one or more services will also be displayed along with the service and other health information.
Work In Progress
The Work in Progress page presents information about the queues that transport data in a standalone or distributed SCM deployment in your organization.
In this topic
Steps to view the Work In Progress page
About the Work In Progress page
Steps to view the Work In Progress page
1.From the navigation panel, expand ACTIVITY and then click WORK IN PROGRESS. The Work In Progress page opens.
2.Click By Service tab to view the messages in the service queues.
-or-
Click By Queues tab to view the messages in each queue.
About the Work In Progress page
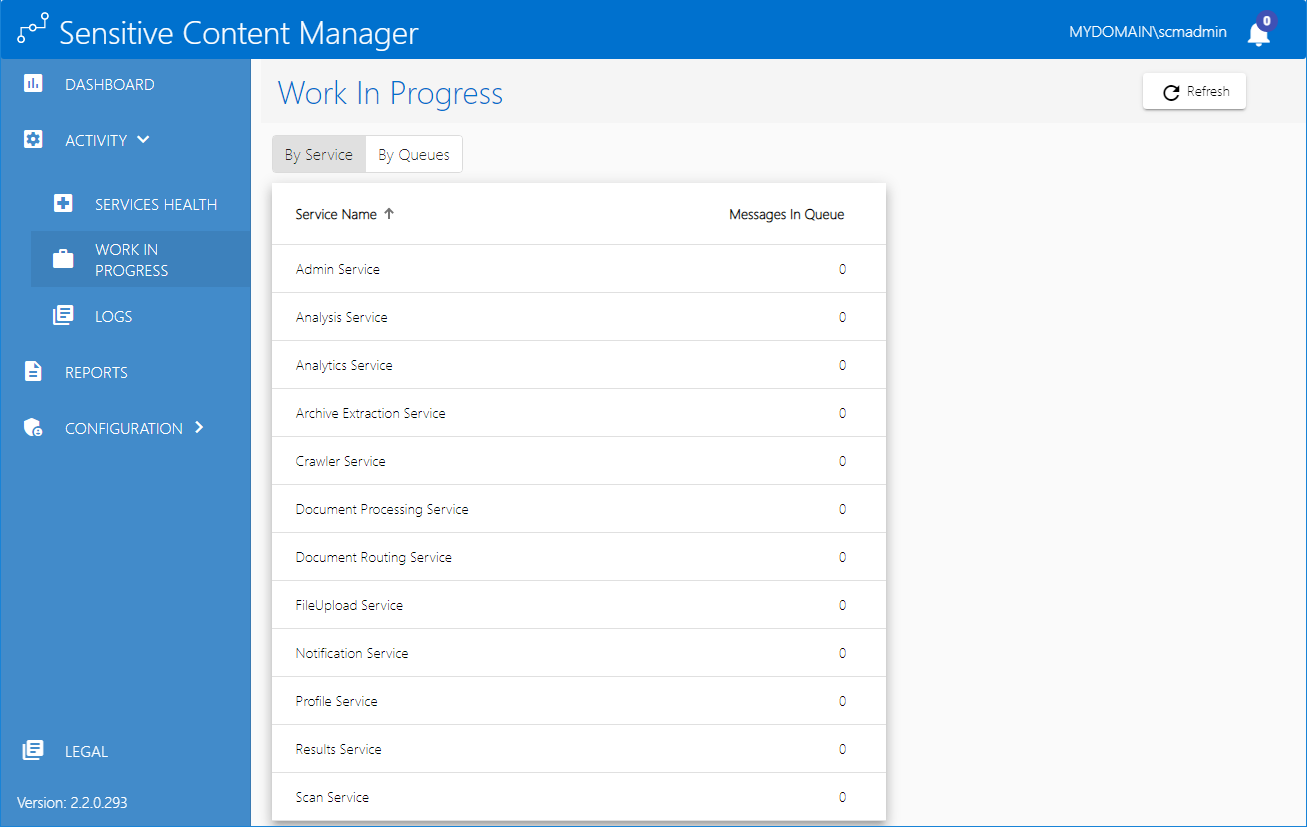
The Work In Progress page presents a snapshot of the number of messages in various queues. Click Refresh to retrieve and display the latest message counts from the SCM repository. This page has two sections as described below:
By Service
This tab displays the following information about the service queues. A service queue could have one or more message queues that transport data.
a.Service Name - name of the service queue.
b.Messages in Queue - number of messages across all the queues in the service. Click Refresh to update the information on this page.
By Queues
This tab displays the following information about the service queues.
a.Queue - name of the message queue. The format of the name is message-category_service-name.
b.Messages in Queue - number of messages in the queue. Click Refresh to update the information on this page.

Click Refresh to update the information on this page.
Logs
The Logs page displays collected details about application service events.
In this topic
1.From the navigation panel, expand ACTIVITY and then click LOGS. The Logs page opens.
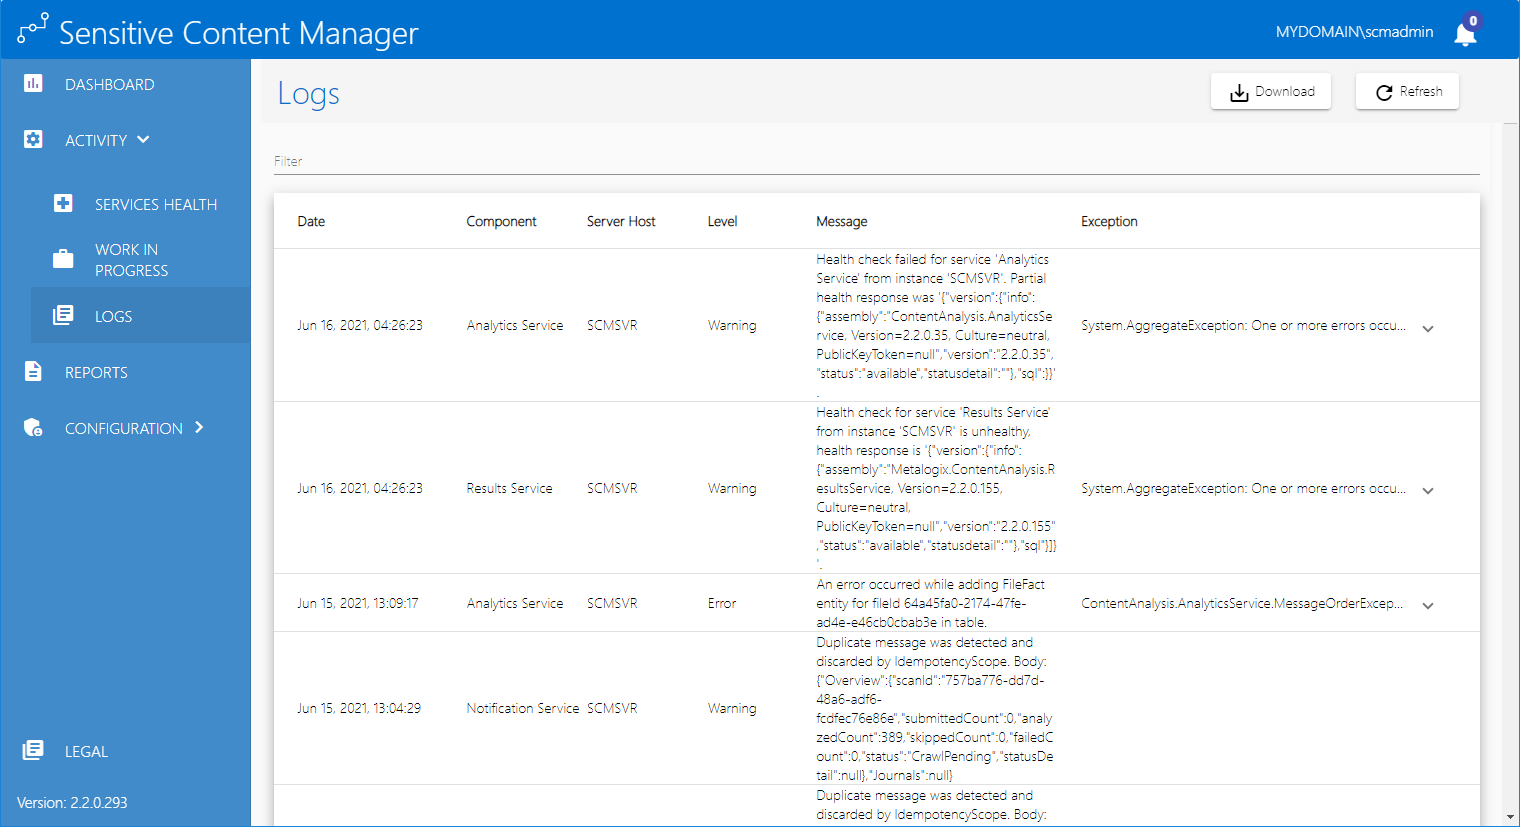
The Logs list presents the information about the system and services as described below. You can sort and filter each column in the Logs list. The filter recognizes a keyword and does not support logical operators or wildcard characters. The columns in the Logs list are described below:
a.Date - local date and time when the log entry was written.
b.Component - name of the SCM service.
c.Server Host - name of the saver where the SCM service is hosted.
d.Level - granularity level of the log. See Settings for more information about managing the log level.
e.Message - information about the log entry.
f.Exception - detailed error description when the log level is an Error.
·To customize the number of items displayed on the page, click the Items per page drop down below the list and choose the number of items you wish to display. If there are more profiles than the list can display, you can use the navigation links below the list to browse through more profiles.
·Enter a keyword in the Filter field above the list to filter the logs by the keyword entered.
·Click Refresh to retrieve and display the latest log entries from the SCM repository.
The Export Logs dialog provides a filter with which a user can specify the criteria for exporting SCM log data.
·About the Export Logs search criteria
1.From the navigation panel, click ACTIVITY and then click LOGS. The Logs page opens.
2.Click Download. The Export Logs dialog open.
3.Specify the export criteria and click Download. The data is exported to the exportLogs.csv or exportLogs.json file as specified in the Download format field.
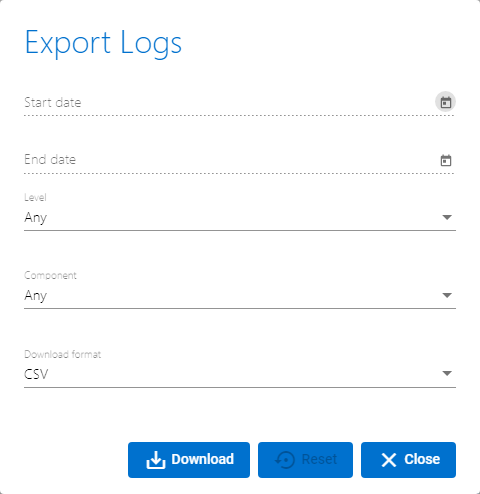
About the Export Logs search criteria
The search criteria are described below.
a.Start Date - date from when the logs will be exported.
b.End Date - date until when the logs will be exported.
c.Level - log level to export. Possible choices are: Any, Verbose, Debug, Information, Warning, Error and Fatal.
d.Component - name of the SCM Service. Possible choices are: Any, Admin Service, Analysis Service, Archive Extraction Service, Crawler Service, Document Routing Service, Document Processing Service, File Upload Service, Profile Service, Results Service, SubQuestions Service and Scan Service.
e.Download format - select from CSV or JSON.
f.Click Export to export the results or Reset to clear the criteria. Click Close to close the Export Logs dialog.