Chat now with support
Chat with Support

Foglight 5.9.8 - Administration and Configuration Guide

Administering and Configuring Foglight Extending Your Monitoring Reach with Foglight Cartridges Administering Foglight Configure Rules and Metric Calculations to Discover Bottlenecks Customizing Your Foglight Environment with Tooling

Schema Browser

The Schema Browser dashboard shows the structure of the data model and allows you better understand the database schema and the existing object dependencies.

1
On the navigation panel, under Dashboards, choose Development Tools > Schema Browser.
To narrow down the search criteria, type a character in the Search by Name box (for example, Host) and click Search.
To search by a regular expression, click Property Search. Type the property name or the topology type, and click Search.
3
When you select an object type, you can sort by various constituents of the object by using the View by options: Properties, Ancestors, Descendants, and Instances.

Database Overview

Use the Database Overview dashboard to see the state of the Foglight database and its activity. This dashboard contains several views that show the row operations, database buffer pool, and/or the number of inserts, deletes, and/or updates. Its appearance depends on the database type in use. For MySQL databases, this dashboard shows four different views: Row Operations, Database Buffer Pool Status, Database Data I/O, and Database Page I/O. For Oracle, PostgreSQL and MS SQL Server databases, the dashboard shows only the Row Operations view.

1
In the navigation panel, under Dashboards, click Management Server > Servers > Database Overview.
2
Choose the database type from the Choose a Foglight Server box.
NOTE: If Choose a Foglight Server does not contain entries for Oracle or MS SQL Server, databases, you might need to grant additional permissions to the database user. For more information, see Grant permissions to explore database activities.

The name of the metrics that contain database reads, inserts, and updates depend on the type of the supported database that Foglight uses to store information, as indicated in the following table.

num_rows_deleted

num_rows_inserted

num_rows_updated

innodb_rows_inserted

innodb_rows_inserted_per5min: #innodb_rows_inserted# * 300

avg_inserts_per5min: avg(#innodb_rows_inserted_per5min for 60 minutes#)

qa_db_inserts : select sum(inserts) from sys.dba_tab_modifications where TABLE_OWNER='xxxx'

delta_db_inserts: delta(#qa_db_inserts from QA_DB_INSERTS_Agent_Table_DB_INSERT_COUNT#)

delta_avg_per5min: avg(#delta_db_inserts for 60 minutes#)

To populate the database charts that are available for Oracle and Microsoft SQL Server on the navigation panel under Dashboards > Management Server > Servers > Database Overview, you need to grant the special permissions on the back-end database for the Foglight Management Server. For a MySQL or PostgreSQL database, special permissions are not required.

Where fmsdbuser is the name of the Foglight database user, as defined by the foglight.database.user parameter in <Foglight_home>/config/server.config.

Persistence Handler Overview

The Persistence Handler Overview dashboard contains charts that display information about the persistence handler such as the number of rows in the table, data length, index length, batch insert time, and query time.

1
On the navigation panel, under Dashboards, click Management Server > Servers > Persistence Handler Overview.

Data Management

Use the Object Cleanup dashboard when you need to inspect, purge, and delete data objects, and particularly for removing objects that are no longer needed.

As an example, deleting agent instances from the Services dashboard removes the agent definitions. However, you can still view the agent entries in other dashboards such as the dashboard for Oracle. To remove the agent entries from these dashboards, you need to delete the agents using the Object Cleanup dashboard to remove the services and OracleModel Instances that were created for the Oracle dashboard.

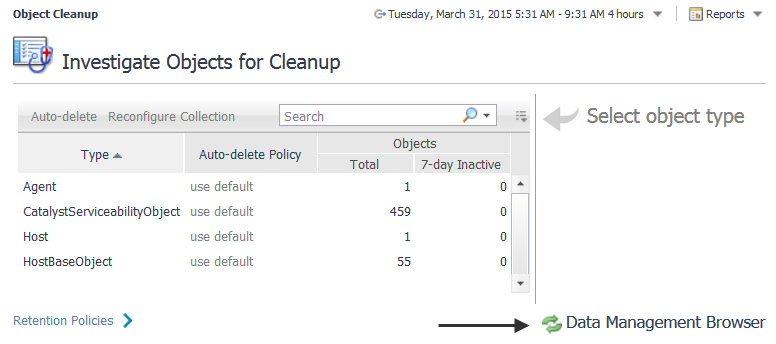
Foglight builds topology models at run-time using the data collected from your monitored systems, and keeps information related to monitored types indefinitely. Global Default setting can be used so objects are not kept indefinitely. Objects that are not expected to change or update are considered stale. These stale objects consume monitoring resources and can be cleaned up. If you have a very large number of stale objects, this may indicate a misconfiguration of your monitoring environment.

Use the Object Cleanup dashboard to remove stale objects, and to reconfigure your URL transformation rules if necessary.

On the navigation panel, under Dashboards, click Management Server > Servers > Object Cleanup.

The following walkthrough demonstrates how to locate and manage stale types based on the default settings provided. In this example, we are using Catalyst Serviceability Object as the type with too many objects.

2
Select CatalystServiceabilityObject in the list.
The CatalystServiceabilityObject pane appears.
IMPORTANT: After you type a new number in the since box, you must press Apply to ensure the value is updated.
The % usage (current/capacity) and Filtered Objects (those that match your selection) numbers update automatically based on your selection.
If you know that there are stale objects that were created but never updated, you can filter on Inactive since x time range, where the time range could be days, weeks, months, or years. This case is useful for cleaning up older types.
IMPORTANT: After you type a new number in the since box, you must press Apply to ensure the value is updated.
The % usage (current/capacity) and Filtered Objects (those that match your selection) numbers update automatically based on your selection.

You can configure the number of days each type object is allowed to remain inactive before being automatically deleted.

2
Click Auto-delete.
5

Use the Retention Policy dashboard to set system-wide policies for managing database growth through automatic data aggregation and data purges. You can use standard policies (for example, short-term, long-term, or managed roll-ups) or create a custom retention policy.

When a specific retention policy has not been defined, the system-wide retention policies are used by default.

If you find that the standard retention policies do not meet your needs (that is, long-term policy retains granular data for a longer period than what is required) you can create a custom retention policy.

For example, if you want to change the retention policy to have more granular data (that is, for at least one day) such as for capturing reporting data. After a day, you want to roll up that data to an hourly average and kept for a week. Beyond that, you want to keep a daily average for 15 months.

You can also navigate to an advanced dashboard to set rollups per object, using the Manage Retention Policies dashboard in the Administration module. For more information, see Manage Data Retention.

To create a custom retention policy:

1
On the navigation panel, under Dashboards, click Management Server > Servers > Retention Policies.
2
In the Retention Policy area, click Edit.
The Retention Policy dialog box opens.
4

Use the Manage Monitored Objects table to look at some of the common objects (organized by domain) in Foglight. For example, you can see that some old host and agent objects should be removed as they were part of the early testing of deployment. For each object you can see the amount of data for that object and its children in the total size. This is a handy breakdown as it gives you an idea of what data is returned.

1
On the navigation panel, under Dashboards, click Management Server > Servers > Object Cleanup.
2
Click the Data Management Browser link in the bottom right-hand corner.

Object

Name

Name of the object or its children. Click object to view a popup for additional details about the object.

Direct database size


Estimate of the metric instances for the object and its children.

Topology

Displays the size of data (accumulated and directly) and its dependent objects.

Observations

Gives an idea of the direct (topology) size and any non-containment property.

Purged


Shows whether the current node has been purged. If Yes appears in the column, you can click it to see the purge details.

Last Updated


Shows the last time at which data was collected for a particular object and its children.

This column ignore model alarm count calculations.

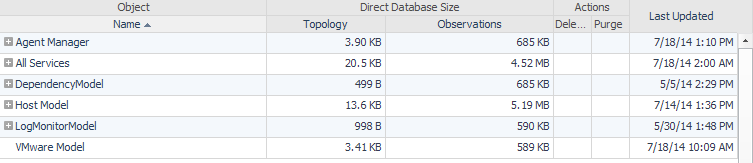
Use the Delete, Purge for objects, or Purge for types options in the header of the table to manage data objects.

Delete — Use this option to immediately delete the object, the object metric, or delete the object tree. You can choose whether to delete an object individually or delete its tree and also choose whether or not to delete the metrics associated with an object. For example, if you choose to delete a host, all data associated with the host is deleted.

Purge for objects — Use this option to schedule the removal of the observations for a selected object during the database off-hours maintenance cycle. By default, this maintenance is scheduled at the end of the month. For more information, see Purge data objects.

Purge for types — Use this option to schedule the removal of objects by types during the database off-hours maintenance cycle. By default, this maintenance is scheduled at the end of the month. For more information, see Purge data objects.

Use the Direct Database Size area to evaluate the current storage allocation for each object in the system and to purge/delete unwanted objects from the system. For example, you can figure out where space is used by viewing how much and where the space is being used.

By viewing the size of the direct database you can see immediately how much space is being consumed by the database, as well as the number of metrics. You can also see a breakdown of space by metric age. For example, from the table you can tell there is a lot of old data and you can decide if you want to keep some old data, or which data to delete or purge.

Use the purge feature if you want to keep the topology object for a nightly cycle. Within a 24 hour period, the data object should be gone from the topology tree.

1
On the navigation panel, under Dashboards, select Management Server > Servers > Object Cleanup.
2
Click the Data Management Browser link in the bottom right-hand corner.
5
Click Purge for objects or Purge for types, as necessary.
7
Click Set.

When you delete an object, you actually remove the topology object immediately from the tree, including all of its children. For example, you may want to delete a data object if you have old data on a decommissioned host and want to remove the topology objects. If you delete an object that is still active, it will be re-created.

1
On the navigation panel, under Dashboards, choose Management Server > Servers > Object Cleanup.
2
Click the Data Management Browser link in the bottom right-hand corner.
4
Click Delete beside the object to remove the object and all of its children.
5
Click Yes to the confirmation message Are you sure you want to delete this object and all of its children?.
Related Documents

The document was helpful.

Select Rating

I easily found the information I needed.

Select Rating