To open the Executions / Second Versus Time page
Open the SQL Performance page. Select a SQL statement from the SQL Performance Predictions grid.
Executions per Second versus Time shows how the rate of executions for the specified SQL statement will change between now and the specified end-date.
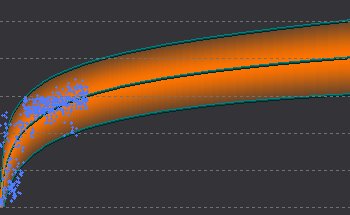
Chart data points
| Data Points | Description |
|---|---|
| The raw data ( |
The actual data used to generate the chart. |
| New data (in a contrasting color) | New data (when available) is data collected AFTER the raw data was analyzed. |
| The shaded region | The Prediction Interval that is based on the raw data. |
| A vertical trend change line |
If displayed, it shows the early data follows a different trend from the more recent data. Trend Changes The early data is not used in making predictions. Note: You can set a Trend Change line via the chart toolbar. |
Chart toolbar
| Toolbar | Description |
|---|---|
|
Add Trend Change |
Mark trend changes on the Predictive Diagnostics chart. In the Add Trend Change window:
|
|
Delete Trend Change |
Remove trend change lines from the chart. In the Delete Trend Change window, select the Delete? option that corresponds to the line you want to remove. |

Accept suggested trend change |
If Predictive Diagnostics notices a possible trend change it will mark it on the chart and prompt you to accept or reject it. |

Reject suggested trend change |
|
|
Reanalyze |
Generate a new Prediction Interval on the chart from the raw data. |
You can mark a trend change on the chart wherever you like, but the trend change is valid only in circumstances where it represents a REAL change in Oracle's handling of SQL statement executions, system bottlenecks, or database resources.
Note: Trend changes in SQL Performance Predictions charts apply only to the specified chart for the selected SQL statement. Predictions on the execution of SQL statements are specific to the SQL statements themselves. If one SQL statement will perform poorly on the Oracle database as data volumes and SQL execution rates increase, the same does not necessarily apply to other SQL statements. Equally, a SQL statement whose performance scales adequately with respect to one cost metric (CPU time, for example) may not scale adequately with respect to another (Disk Reads, for example).
The Cost Summary for the SQL statement contains this information:


