Chat now with support
Chat with Support

Spotlight on Oracle 10.10 - Getting Started Guide

Welcome to Spotlight Install Spotlight Start Spotlight Spotlight on Oracle Spotlight on Oracle Data Guard Spotlight on Oracle RAC Spotlight on Unix Spotlight on Windows Troubleshooting: Connection Problems

SGA Panel


The SGA panel shows details of specific memory areas within the system global area (SGA). The SGA is an area of shared or common process memory that is used to cache frequently used data, SQL statements, procedures and other structures:

Panel Components

The size of the buffer cache and its components. These hold data that is accessed frequently.

Buffer Cache

In order to avoid a disk I/O, the buffer cache is used to cache frequently-accessed data blocks that may subsequently be required. The size of the buffer cache is controlled by the parameter DB_nK_CACHE_SIZE.

Recycle Pool

The size of the RECYCLE pool in the buffer cache.

Usually, a single DEFAULT buffer pool is adequate, but some Oracle systems store segments in multiple buffer pools: the DEFAULT pool, KEEP pool, and RECYCLE pool.

A RECYCLE buffer pool is designed to contain blocks belonging to segments that are not frequently accessed.

Keep Pool

The size of the KEEP Pool in the buffer cache.

Usually, a single DEFAULT buffer pool is adequate, but some Oracle systems store segments in multiple buffer pools: the DEFAULT pool, KEEP pool, and RECYCLE pool.

A KEEP buffer pool is designed to maintain frequently accessed segments in the buffer cache.

Note: There are limits to how many blocks the KEEP pool can contain. If it is not large enough to store all the segments allocated to it, the oldest blocks age out of the cache.

Buffer Cache Hit Ratio

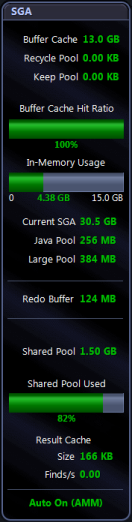
The buffer cache hit ratio calculates how often a requested block has been found in the buffer cache without requiring disk access. If the requested block is NOT found in the buffer cache, it must be retrieved from disk.

Alarms that may be raised on this component include:

Within an Oracle RAC cluster, this component may also raise a number of RAC-related alarms.

More about the buffer cache hit ratio

The buffer cache hit ratio is one of the most significant tuning ratios. Untuned values can lead to unnecessarily high disk I/O rates and contention for internal resources (latches).

To improve the buffer cache hit ratio, you can increase the size of the buffer cache by increasing the size of the DB_BLOCK_BUFFERS configuration parameter.

Applications that perform frequent table scans of large tables (such as data warehouses) may see little benefit from increasing the buffer cache. For these applications, low buffer cache hit ratios may be unavoidable.

In-Memory Usage

Shows the amount of memory allocated to the In-Memory column store, and how much of that memory is in use.

Note: Oracle In-Memory is available for Oracle 12c Release 1 (12.1.0.2) and above. Data is displayed for Oracle instances where In-Memory is available and has been enabled. In-Memory is disabled by default.


Current SGA The current size of the System Global Area (SGA).
Java Pool The Java Pool caches class definitions, Java methods, and Java objects. The size of the Java pool is controlled by the JAVA_POOL_SIZE parameter.
Large Pool

The Large Pool metric shows the size of the large pool allocation heap. It is used in MTS for session memory. It can be used by parallel execution and backup processes. The size of the large pool is controlled by the LARGE_POOL_SIZE parameter.

When the large pool allocation heap is full, Spotlight raises the Large Pool Full Alarm.

Redo Buffer

The size of the redo buffer. The redo buffer contains redo entries that must eventually be written to the redo log. Alarms can become current if processes spend time waiting for space in the redo buffer (Log Buffer Space Wait Alarm), or for redo buffer latches (Redo Allocation Latch and Redo Copy Latch Wait Alarms).

Shared Pool

The shared pool caches SQL statements, PL/SQL programs, object definitions, and session memory for MTS sessions.

A Spotlight user with ALTER SYSTEM privileges can flush data manually from the shared pool. To do so, right-click the Shared Pool or Shared Pool Used component and choose Flush from the shortcut menu. (This option exists only for Oracle versions where manual flushing is supported.)

Note: Flushing the shared pool may adversely affect the performance of the database in the short term.

Shared Pool Used

This shows how much of the shared pool is used, expressed as a percentage of its total size. The shared pool caches SQL statements, PL/SQL programs, object definitions, and session memory for MTS sessions.

  • The Estimated Shared Pool Size Alarm occurs when the Shared pool is set too small. A possible cause is the use of literals rather than bind variables in SQL statements. You can also increase the size of the shared pool.
  • The Estimated Shared Pool Size Alarm can become current on this component if a low hit rate is observed for cached SQL statements.
  • The Shared Pool Lock Percentage Alarm is raised when one session holds a lock on object(s) in the Shared Pool for a prolonged period, and causes other sessions to wait on the same resource.
  • The Library Cache Latch Wait Alarms occur when there is contention for the library cache latch — that is, if the library cache latch and/or library cache pin latch sleep rates exceed a threshold.

A Spotlight user with ALTER SYSTEM privileges can flush data manually from the shared pool. To do so, right-click on the Shared Pool or Shared Pool Used component and choose Flush from the shortcut menu. (This option exists only for Oracle versions where manual flushing is supported.)

Note: Flushing the shared pool may adversely affect the performance of the database in the short term.

Result Cache Size

The size of the result cache.

When Oracle executes SQL queries, the result cache stores the result sets of specified queries in shared memory. When one of those specified queries is re-run, Oracle can re-use the result set, and so avoid most of the cost of executing that query.

To view performance data for the result cache, go to the Result Cache Page.

Result Cache Finds/s The rate at which result sets are found in the result cache. To view performance data for the result cache, go to the Result Cache Page.
Auto On/Off

This label specifies whether the Oracle database under investigation is in manual or auto memory management mode (Oracle 10g and later). It displays the management mode as one of the following:

  • Auto Off — Automatic memory management is OFF.
  • Auto On (ASMM) — Automatic shared memory management is ON for the SGA (system global area).
  • Auto On (AMM) — (Oracle 11g and later) Automatic memory management is ON for the SGA and PGA (program global area).

Note: Available for Oracle 10g and later.


Data Flows to Background Processes

Physical Reads/s

The rate at which blocks are read from disk by all server processes.

Physical Writes/s (Database Writer) The dataflow from the SGA panel to DBWR in the Background Processes panel shows the rate at which blocks are being written by the database writer (DBWR) process.
Recovery Writes/s (Recovery Writer)

The number of I/O write operations per second to the flash recovery area. Writes will increase as database change activity increases. This may occur when:

  • The database updates the flashback logs.
  • The database writes to the archived redo logs (if archive logs are stored in the flash recovery area).
Redo Writes/s (Redo Log Writer) The dataflow from the SGA panel to the Redo Log Writer component in the Background Processes panel shows the rate at which redo log blocks are being written by the Redo Log Writer (LGWR) process.

Data Flow to Server Processes

In-Memory Scan Activity

Shows the number of blocks per second read from the In-Memory column store.

Note: Oracle In-Memory is available for Oracle 12c Release 1 (12.1.0.2) and above. Data is displayed for Oracle instances where In-Memory is available and has been enabled. In-Memory is disabled by default.


Related Topics

Related Documents

The document was helpful.

Select Rating

I easily found the information I needed.

Select Rating