Note: Available for Oracle 10.2 and later.
When you have used the When Will Database Resources Reach Their Ceiling? page to predict when database resources will run out, use this page to help determine database resources will run out and what can be done to alleviate the problem.
To open this page
Click Predictive Diagnostics | Why will database resources reach their ceiling?.

Analysis
The database concepts on which Predictive Diagnostics bases its investigation are throughput and concurrency. Throughput is a measure of how fast data moves through the database. Concurrency is a measure of the number of users connected to the database at the same time, though some users may impose a higher workload on the database than others.
Set the initial conditions for predicting why resources will reach their ceiling.
|
Control |
Description |
|---|---|
|
Perform an analysis of... |
Select Real Data (your database) or Sample Data (to experiment with). Note: Spotlight takes some time (typically about 10 days) to collect enough data to make valid predictions on the future performance of your Oracle instance. In the meantime use the prepared sample data to learn more about Predictive Diagnostics and how it works. |
|
Within the processing period... |
Select an activity period to use for your prediction. The more selective this is the better the prediction. Tip: To define new processing periods or redefine an existing processing period see Peak Processing Periods. |
|
For all collected data or For data collected since... |
Click all or the date to open Performance Modeling Oracle Job. If you select a start date in Data Analysis Options then this text reads For data collected since.... Note: The start date should be a date for which recorded data exists. For example, you cannot select a date later than today's date. Use this setting to ignore data that occurred before a specific time. |
| Analyze Disk I/O for. |
The Predictive Diagnostics metric for disk utilization can be either disk latency or disk throughput (Disk Latency And Disk Throughput). Select the one that best suits your environment. |
|
Predict forward until... |
Select an end date for the prediction. |
|
Control |
Description | ||||||||||
|---|---|---|---|---|---|---|---|---|---|---|---|
| Using...for database throughput |
Select a throughput metric to represent the total amount of work performed (Throughput Metrics):
Tip: Choose combinations of the throughput and concurrency metrics to predict which are likely to use up database resources, and which resources will be consumed. | ||||||||||
| Using...for database concurrency |
Select a concurrency metric to represent the number of users (Concurrency Metrics):
Tip: Choose combinations of the throughput and concurrency metrics to predict which are likely to use up database resources, and which resources will be consumed. |
For each combination of metrics, use the charts in the CPU, Memory, Disk I/O and Throughput and Concurrency pages to view how database resources are affected by the load placed on the database.
| Details Page | Description |
|---|---|
| CPU and Memory |
The charts in the CPU and Memory sub-pages display the following relationships, where [Resource] is either CPU or Memory. |
| DISK I/O |
The charts in the Disk I/O sub-page operate in the same way as those in the Memory and CPU sub-pages, but you also need to choose whether to use Disk Latency or Disk Throughput to represent disk utilization. Disk Latency And Disk Throughput |
| Throughput and Concurrency |
Use the charts in the Throughput and Concurrency sub-page to view how the combination of ALL database resources affects the performance of the database over time, as measured by database throughput and database concurrency. Database Throughput And Concurrency By Time
You also can view this sub-page from the What Database Resources Are Needed? page. |
|
Analysis |
Description |
|---|---|
|
[Resource] by Time |
This chart is the same as the [Resource] Utilization by Time chart in the Details section of the When Will Database Resources Reach Their Ceiling? page. |
|
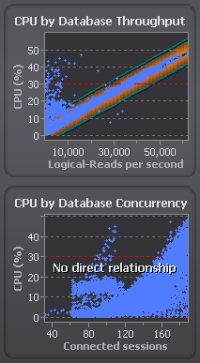
[Resource] by Database Throughput |
This chart shows how the resource varies with the metric (logical reads/s, rows processed/s, SQL executions/s, or transactions/s) chosen to represent database throughput. |
|
[Resource] by Database Concurrency |
This chart shows how the resource varies with the metric (connected sessions, active sessions, or a customized metric) chosen to represent database concurrency. |
Notes:
Where a Throughput or Concurrency chart displays No Direct Relationship, any apparent relationship shown is an artifact of a relationship with the other metric.
This example shows two charts, BOTH of which appear to show an increase in CPU resource use with time.
However, Spotlight's analysis determines that the apparent relationship in the Concurrency chart between CPU and connected sessions only reflects the real relationship in the Throughput chart between CPU and logical reads per second.
Often you cannot identify the resources that affect database performance simply by looking at the charts on the Why Will Database Resources Reach Their Ceiling? page. The limitation of a single resource MAY be responsible for all performance problems, but there also may be other factors at work.
The pane at the right of each Why Will Database Resources Reach Their Ceiling? sub-page provides a summary of the analysis used to draw the charts on the left, and indicates:
Notes:
