Chat now with support
Chat with Support

Foglight 5.9.5 - Performance Tuning Field Guide

Overview Hardware and Operating System Tuning Management Server Tuning Java Virtual Machine Tuning Backend Database Tuning High Availability (HA) Tuning Agent Tuning Appendix: Performance Health Check Appendix: Analyzing a Support Bundle

---- com.quest.nitro:service=DataCacheEviction

This service lists metrics that are being held in the JVM waiting to be written to the database permanently. This information is located in the Cache Policies section of the diagnostic snapshot.

If many (thousands) of metrics are held in memory for long periods of time, they cannot be cleaned up by a garbage collector (GC) because they are active/live objects. Therefore, a large portion of memory is used simply by data that should be written into the database instead. This lead to JVM heap exhaustion, and performance problems.

The following is an example of the Cache Policies section of the diagnostic snapshot:

Cache Policies:

cbc82b6a-1f8c-4fa8-a88a-fcb07af2854e:file_physical_io_pct - age:259200000 granularity:300000 cached duration:259500000 num values:123 delay:192764

c25e1d2-c20b-400e-b87c-b9749c28899a:DBO_File_Avg_Read_Time_Ms - age:259200000 granularity:300000 cached duration:259500000 num values:122 delay:43089

1a6c1537-3050-499d-9e93-1f702b1ab77f:file_read_time - age:259200000 granularity:300000 cached duration:259500000 num values:140 delay:11026

1279f9c8-c72d-4deb-9080-73eeed73d70a:DBO_Datafile_File_Write_Requests_Rate - age:259200000 granularity:300000 cached duration:259500000 num values:118 delay:12308

71d83485-c441-45e9-9cc6-ccd3bb510f71:file_physical_writes - age:259200000 granularity:300000 cached duration:259500000 num values:136 delay:37018

Each line can be broken down as follows:

cbc82b6a-1f8c-4fa8-a88a-fcb07af2854e—topology object ID

file_physical_io_pct—name of the metric

age:259200000—length of time the metric is kept in memory (in ms)

granularity:300000—rawness of the metric value (in ms)

num values:123—number of values of this metric on this object

delay:19276—length of time the metric has been in memory

You can search the diagnostic snapshot for the metric name, and locate its parent topology in the XML schema. For example, for the metric detailed above:

<property name='file_physical_io_pct' type='Metric' is-many='false' is-containment='true' unit-name='count'>
<annotation name='UnitEntityName' value='percents'/>
</property>

This metric is contained in the following XML tag:

<type name='DBO_Datafile_IO_Activity'
extends='DBO_Instance_Alarm_Object'>

This indicates that the file_phyiscal_io_pct metric is part of the DBO topology.

Contact Quest Support with this information for further assistance and to determine if the issue has been resolved in the latest version of the affected cartridge.

Analyzing a Performance Report

The Support Bundle contains a Management Server Performance Report (PerfReport.pdf), which can be helpful in diagnosing issues related to server performance.

Server Rule Information

Check the following:

Foglight® Garbage Collector (GC) Check: Indicates JVM Heap usage problems. Large numbers of GC indicate the GC is working hard but doing little. Few or no alarms indicate the server is in a good state; hundreds of alarms indicate an issue.

System-wide Topology Changes

Topology changes should be considered over a 7-day span.

Some cartridges generate new topology objects regularly and this is considered normal behavior. Such cartridges can produce hundreds of changes over a 7-day span.

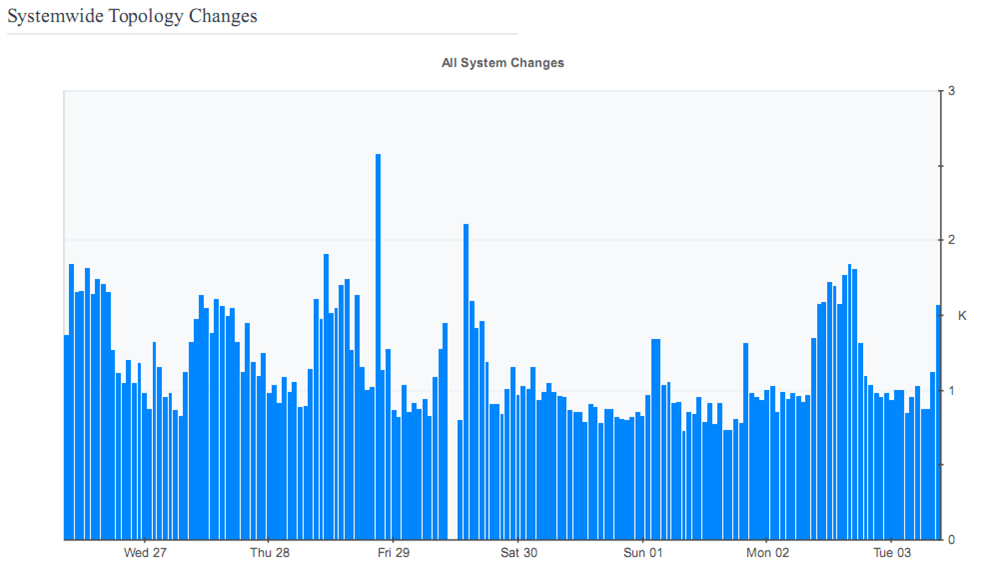
If thousands of changes are generated, however, there may be an issue. In such cases, review the diagnostic snapshot to determine if there are Topology Related Issues.

Related Documents

The document was helpful.

Select Rating

I easily found the information I needed.

Select Rating