Chart Setting Tab
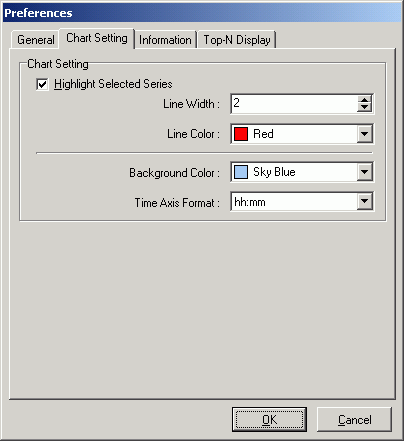
The Chart Setting tab on the Preferences window for the Performance Monitor is for controlling the display of the charts.
Chart Setting
Highlight Selected Series (Default = checked)
The following settings affect the chart display of the selected statistic when you have drilled down to the bottom level of information.
Line Width (Default: 2 Range: 2 - 10)
Specify the width of the line for the statistic that you have selected in the left pane. This is used to enable the statistic selected in the left pane to stand out from the other statistics in the chart.
Line Color (Default = Red)
Select the color for the selected statistic from the drop-down list.
Background Color (Default = Sky Blue)
Select the color for the chart background from the drop-down list.
Time Axis Format (Default = hh:mm)
Select the format for displaying the date and time on the chart from the drop-down list.
Information Tab
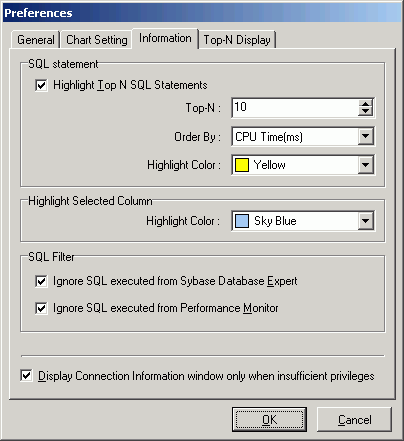
The Information tab on the Preferences window for the Performance Monitor determines which of the top SQL statements are highlighted, sets highlighting colors, and sets the automatic display of the connection information when logging on.
SQL statement
In the left pane of the Performance Monitor window, individual SQL statements are displayed when you drill down from Information to Process Information to the Executing SQL Statements. The following settings determine how many SQL statements are highlighted, by what criteria they are sorted, and the color that is used for highlighting.
Highlight Top N SQL Statements (Default = checked)
The top SQL statements are highlighted for you to quickly identify which SQL statements are consuming the most resources.
Specify the number of SQL statements to be highlighted.
Order By (Default = CPU Time(ms))
Select the statistic to sort the SQL statements from the drop-down field.
Highlight Color (Default = Yellow)
Select the color from the drop-down field.
Highlight selected column
When you drill down to the lowest level of the charts, the data from the table displays in a grid underneath the chart. The column for the statistic that is selected in the left pane is highlighted.
Highlight Color (Default = Sky Blue)
Select the color from the drop-down field.
SQL Filter (executing SQL only)
Ignore SQL executed from SQL Optimizer Default = checked)
Specify to exclude the SQL statements that are generated by any of the modules in SQL Optimizer but the Performance Monitor.
Ignore SQL executed from Performance Monitor (Default = checked)
Specify to exclude the SQL statements that are generated by the Performance Monitor.
Display Connection Information window only when insufficient privileges (Default = checked)
Specify to display the Connection Information window each time you logon if the user logon does not have the database privileges needed for the modules.
Top-N Display Tab
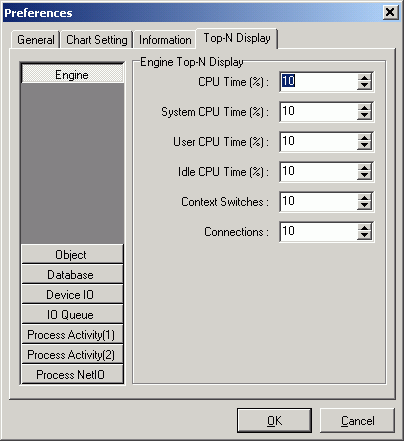
The Top-N Display tab on the Preferences window for the Performance Monitor is for determining the percent of each statistics that is retrieved from the monitoring tables.
To select only the top statistics
Select the button on the left for the statistics information and fill in the values on the right for each individual statistic.
Please reference the Adaptive Server Performance and Tuning: Monitor and Analyzing manual for the meaning of each statistic.

 View Performance Monitor - Chart Setting page

