Review Execution Plans
SQL Optimizer provides a variety of formats for displaying an execution plan. After selecting a plan format, you can customize the plan display and the Execution Plan window.
To select a plan format
-
Select a SQL statement.
- Right-click the execution plan and select View Plan | option.
-
Select one of the following formats:
- Tree Plan
- DBMS_XPlan (Formatted)
- DBMS_XPlan (Plain Text)
- Graphic Plan
- MS Graphic Plan
- Plain Language Plan
- For more information about each format, review the following sections.
Plan Formats
To use the Tree Plan
-
Right-click an execution plan and select View Plan | As Tree Plan.
- Review the steps. The first line of the execution plan displays the SQL statement type, such as SELECT. The remaining lines represent an operation. The steps are numbered in the order of execution to make the plan easier to read.
-
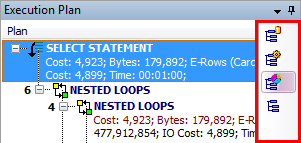
Select a layout style for the tree plan from the Execution Plan toolbar (right panel). Each style displays different plan details (operators, predicates, statistics).
-
To select which items/columns to display in the execution plan, right-click the plan and select Plan Options. The settings will apply to the current module only.
- Select the items to include (such as cost, disk reads/writes).
- Select which items to display as columns.
- To get additional Help on a step, select the step. Then right-click and select Help on plan step.
-
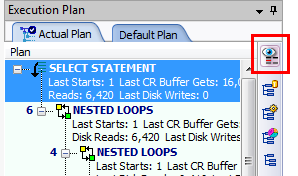
In the Actual Plan tab, to display a comparison of Oracle estimates and actual statistics, click the Plan Comparison button in the Execution Plan toolbar.
- To animate the steps, right-click the plan and select Animate Plan Steps.
To use DBMS_XPlan
- Right-click an execution plan and select View Plan | As DBMS_XPlan (Formatted) or DBMS_XPlan (Plain Text).
- The plan displays using DBMS_XPLAN.
-
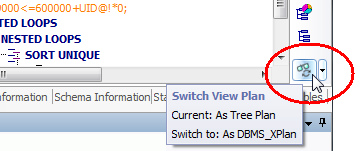
To select a display level for DBMS_XPlan (Formatted), click the arrow beside the Switch DBMS_XPlan level button and select an option.

To use the Plain Language Plan
-
Right-click an execution plan and select View Plan | As Plain Language Plan.
To use Graphic Plan
-
Right-click an execution plan and select View Plan | As Graphic Plan.
- Hover over a step to display step details in a tooltip.
- To animate the steps, right-click the plan and select Animate Plan Steps.
- Right-click the plan and select Step Description to display the step description in plain language in the footer.
- To copy the plan as an image, right-click the plan and select Copy.
To use MS Graphic Plan
-
Right-click an execution plan and select View Plan | As MS Graphic Plan.
- The available options are the same as the Graphic Plan.
To return to previous view
Customize Tree Plan
To customize font style and color
- Go to Options | General | Execution Plan.
- You can customize text color and font style for each item in a plan. Settings apply to all Execution Plan panes. See Execution Plan Options for more information.
- You can also specify warning thresholds for applying highlighting.
Customize Execution Plan Window
To display step description in footer
- Right-click the plan and select Step Description. A description of the selected step displays in the footer of the Execution Plan pane. This is helpful when using one of the graphic displays.
To display additional plan information
- Right-click the plan and select Plan Information to display additional information if the plan uses any of the following: cardinality feedback, dynamic sampling, SQL plan directives, or adaptive plan.
Related Topics
About Execution Plans
Retrieve Execution Plans
Animate Execution Plans
Copy Execution Plans
Animate Execution Plans
You can animate each step in the execution plan in the order SQL Optimizer executes them.
To animate the execution plan or cancel the animation
|
| » |
Right-click the execution plan and select Animate Plan Steps. |
Related Topics
About Execution Plans
Retrieve Execution Plans
Review Execution Plans
Fill Missing Execution Plans
Copy Execution Plans
You can copy an execution plan from the Execution Plan pane and paste it into another file as text or a bitmap image.
To copy an execution plan
- In an Execution Plan pane, right-click the execution plan and select Copy.
- You can then paste the plan using another application such as Microsoft Word or Notepad.
- Tree Plan, DBMS_XPLAN, and Plain Language Plan views can be pasted as text or in bitmap format. Applications such as Microsoft Word allow you to choose the format using the Paste Special option.
- You can use text applications such as Notepad to paste execution plans in text format.
- You can use graphic applications such as Microsoft Paint to paste execution plans in bitmap format.
Related Topics
About Execution Plans
Retrieve Execution Plans
Review Execution Plans
Fill Missing Execution Plans
Flush Shared Pool
You can remove all saved SQL statements from Oracle's SGA by flushing the shared pool before using Inspect SGA to collect SQL. Flushing the shared pool before starting a job collecting currently running SQL can be useful because SQL statistics retrieved are for SQL collected during the specified monitoring time.
Caution: Flushing the shared pool can impact the performance of your production server while the server repopulates its memory buffers.
To flush the shared pool
- Select the Inspect SGA tab in the main window.
- Click
 beside the Group list and select a group.
-
Right-click a job in the Job List pane and select Flush Shared Pool.
Notes:
-
You need to have the privileges to execute the ALTER SYSTEM command to flush the shared pool.
-
Flushing the shared pool before starting a job collecting executed SQL from the SQL area can decrease the number of statements collected.
Related Topics
About Inspect SGA
Use Inspect SGA


 beside the Group list and select a group.