You have the option to add a logo to your report. This allows you to add your own unique branding to each report, including system reports.
To do this:
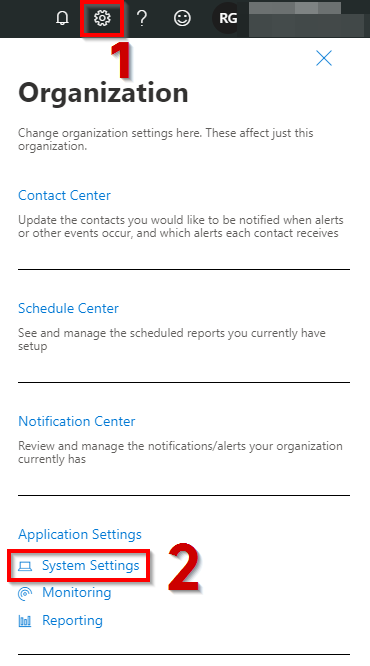
1.Sign in to Nova as an administrator and click on the cog icon in the top right hand corner.
2.Click System Settings in the Organization sidebar.
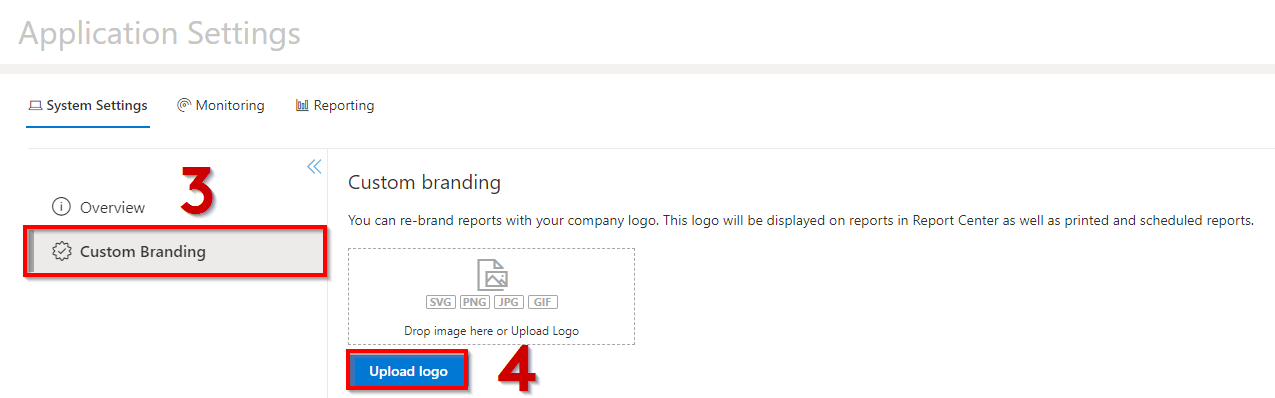
3.In Overview, click Custom Branding.
4.Click Upload logo, then select the image you would like to include in your reports.
Your report should now be located in your reports in both the Nova Report Center and when downloaded as a PDF.
Combining multiple charts allows you to see your data in one easy-to-read graph, giving you easy comparison between a variety of data sources.
You are able to combine as many charts as you like, however there are a few caveats to keep in mind:
·The charts you would like to combine must be the same chart type e.g. bar, line, column. You are unable to combine pie charts.
·The axis types must be the same. This is your applied to and series name categories when creating your chart.
To combine your charts:
1. Create your chart. Remember that only bar, column and line graphs can be used for combining. To see how to create a chart, check out this section.
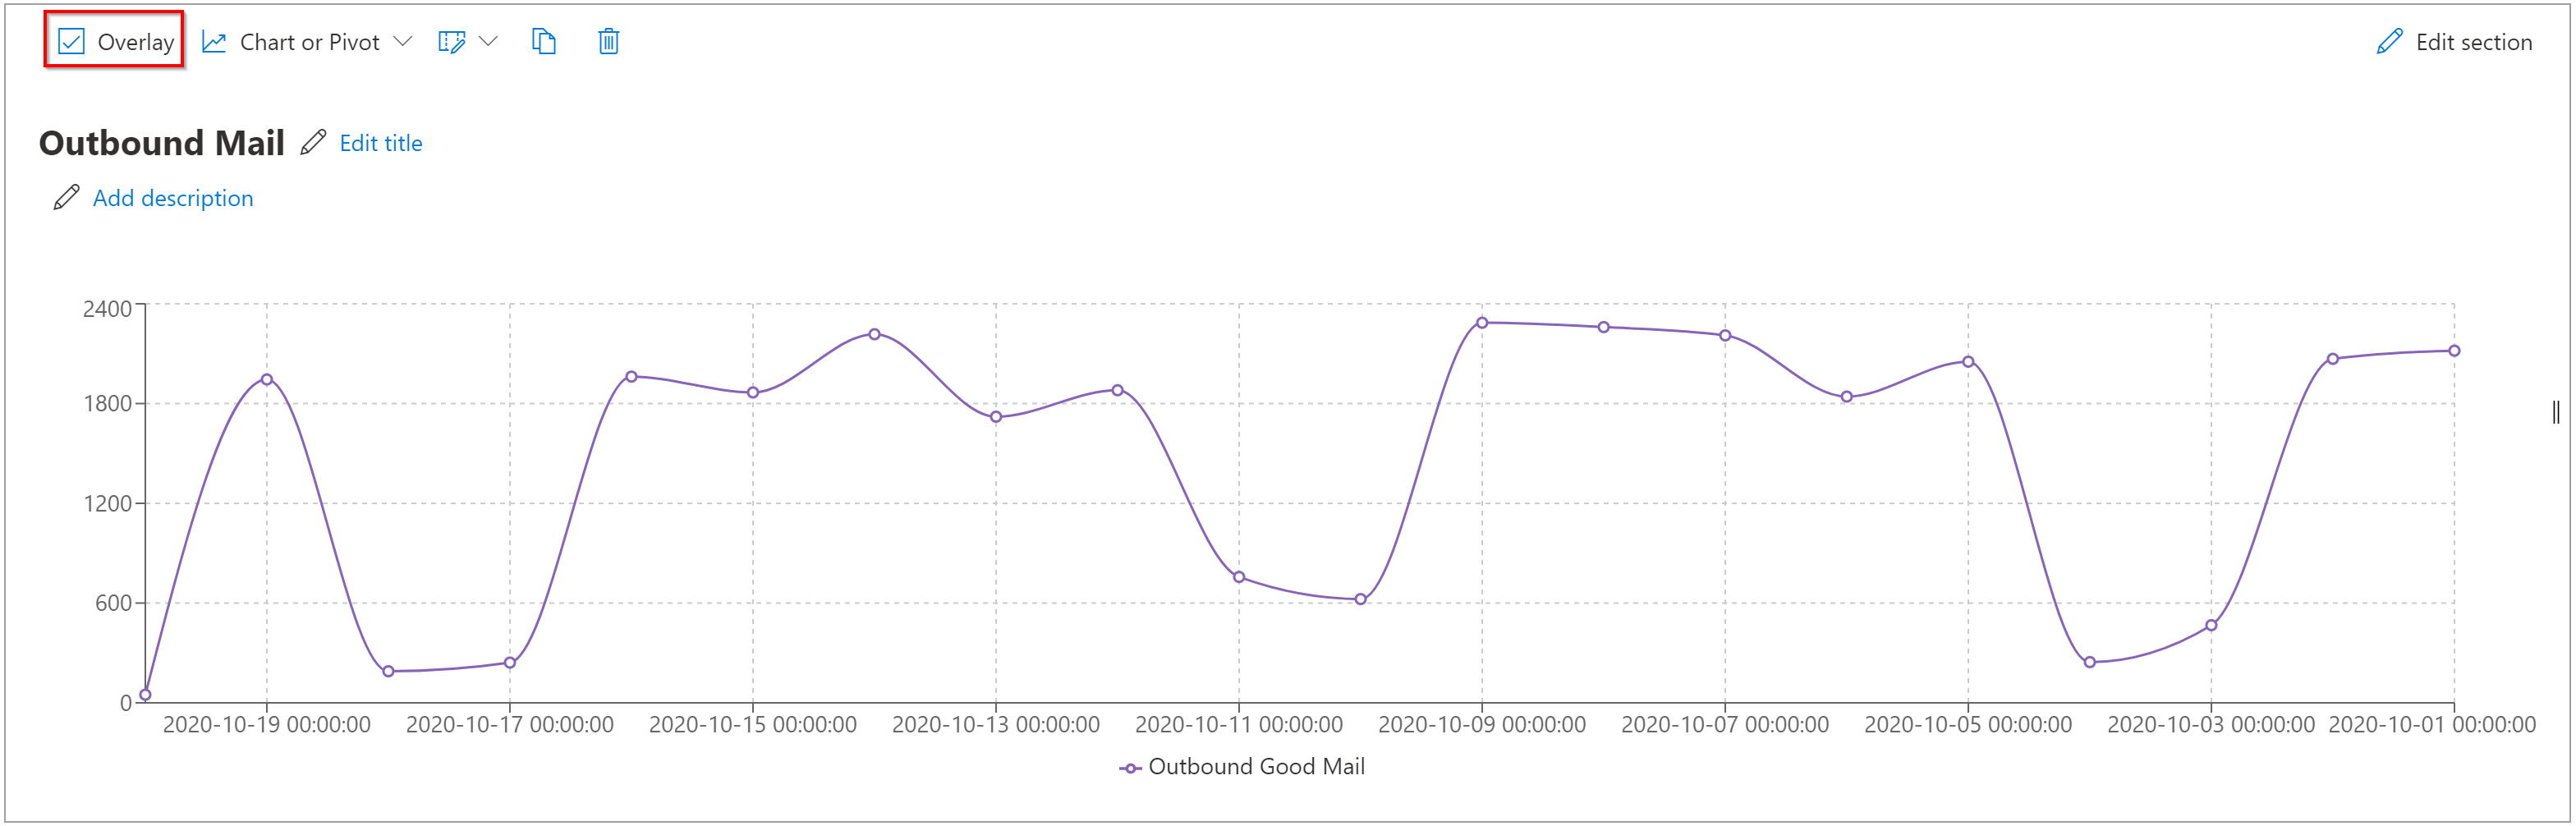
2.Click the Overlay checkbox to select the charts you would like to combine.
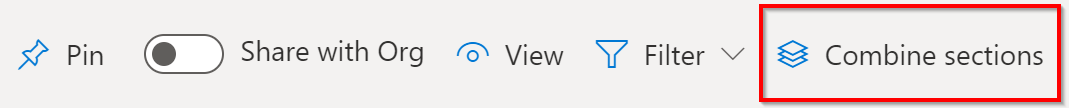
3. Once you have selected 2 or more charts to overlay, click Combine sections.
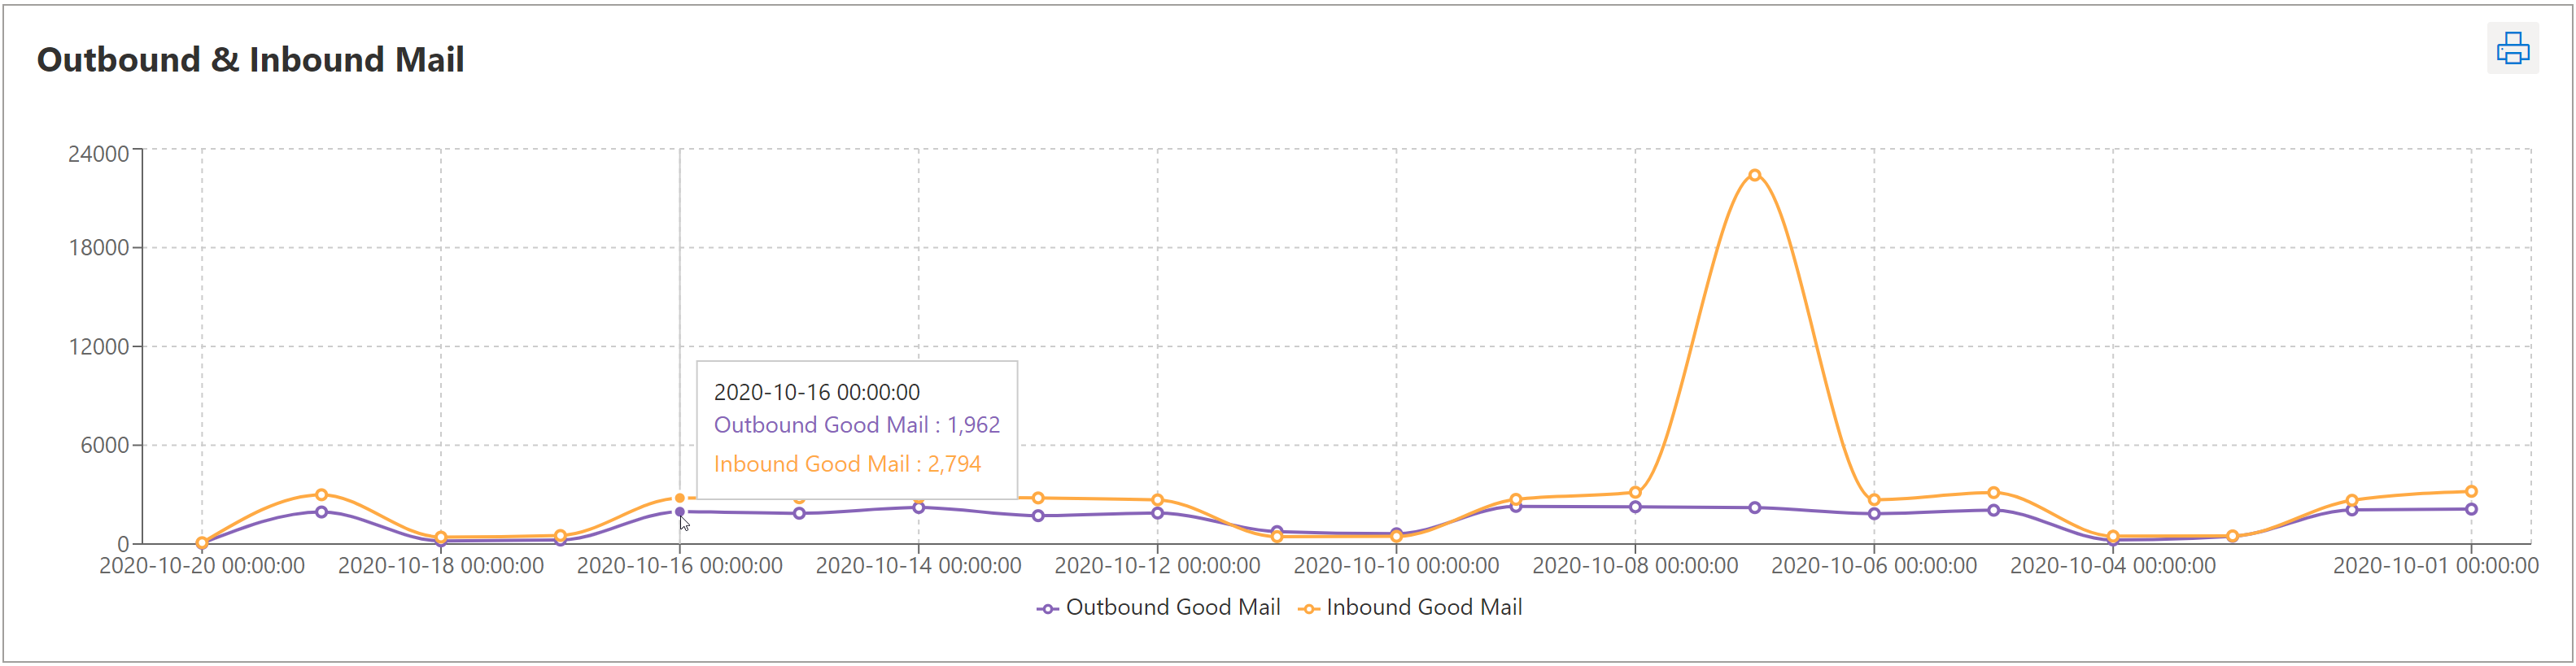
Your charts should now be combined into one. Your sets of data will be individually color coded for easy analysis, and you can hover over your data to get specific numbers.
You can uncombine your charts at any time by clicking Uncombine. This is useful if you need to edit one chart within your combined report, as you can not do so when your charts are combined.
Describing your reports is an excellent way to give other users context to what your report is all about. Before, it was only possible to describe your entire report, giving detail into what it was about, why it is important, how the data is relevant etc. Now, it is possible to describe both your entire report and each individual section. This is for users to better accurately describe what they are reporting on and bring further context to their data. Let us see how to do that below.
Adding a description to a report
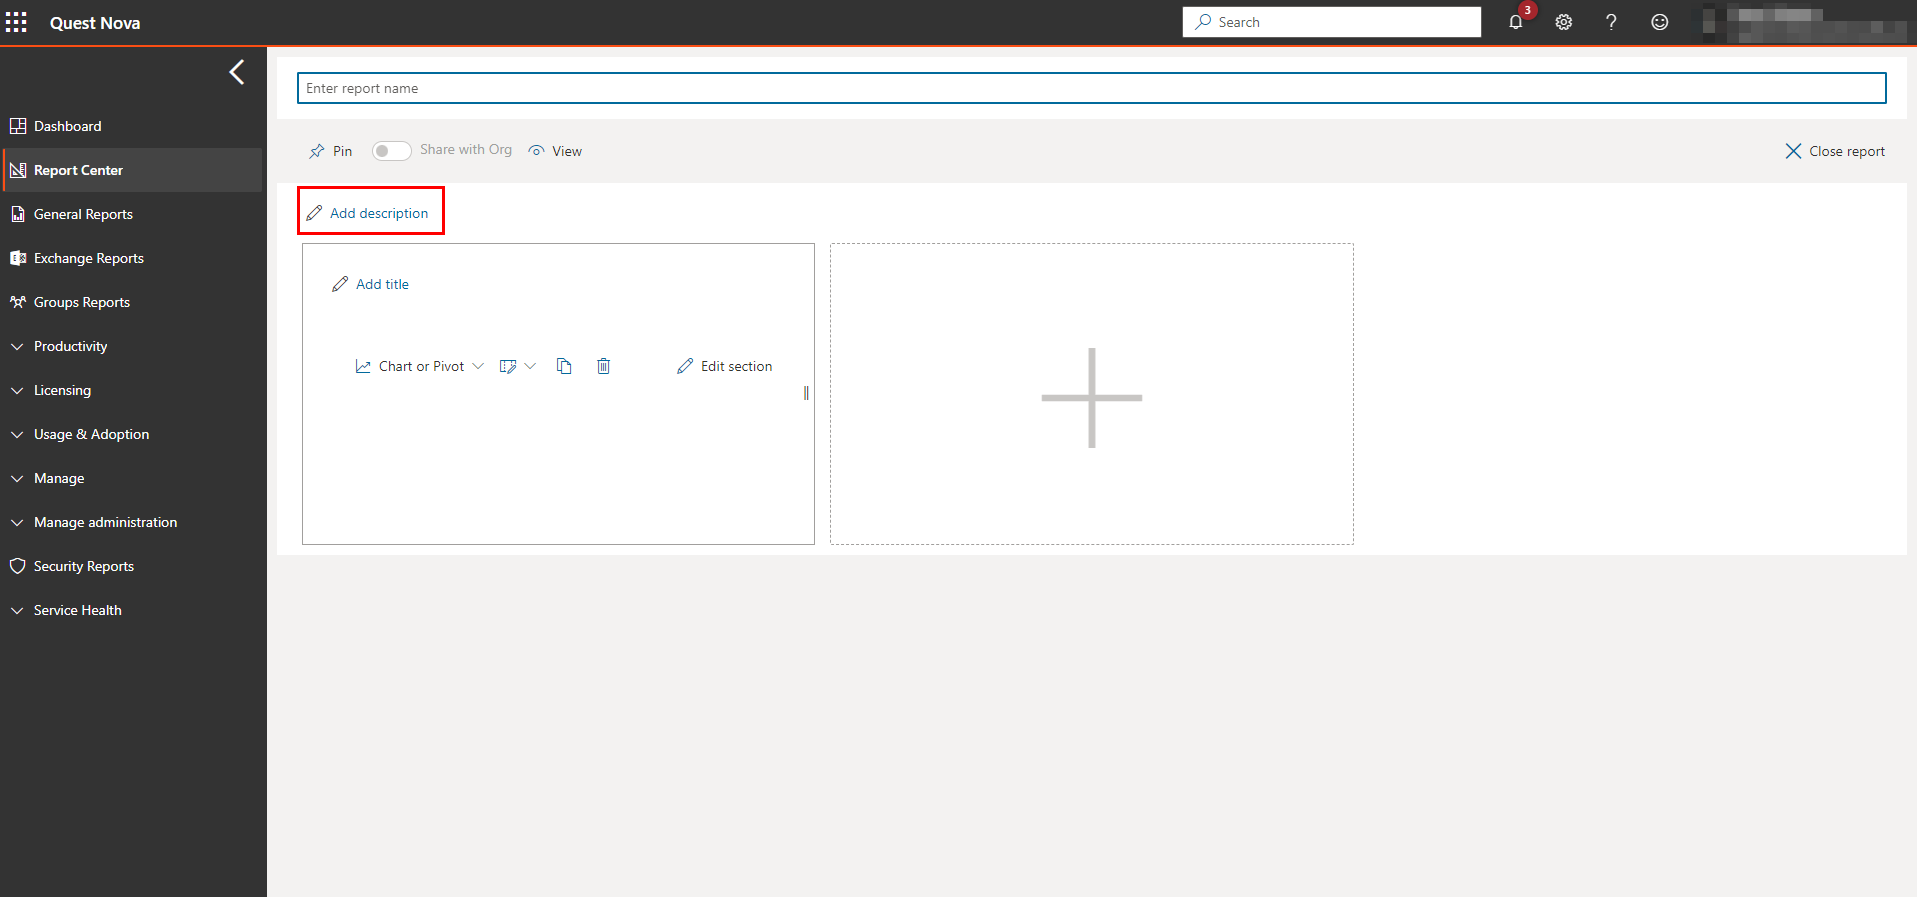
1.Open a report you have previously created, or start a new report by clicking Create Report in the top right hand of the screen.
2.Then click add description' as highlighted below.
3. You can now add your description in the box.
Adding a description to a section
1.Open a report you have previously created, or start a new report by clicking Create Report in the top right hand of the screen.
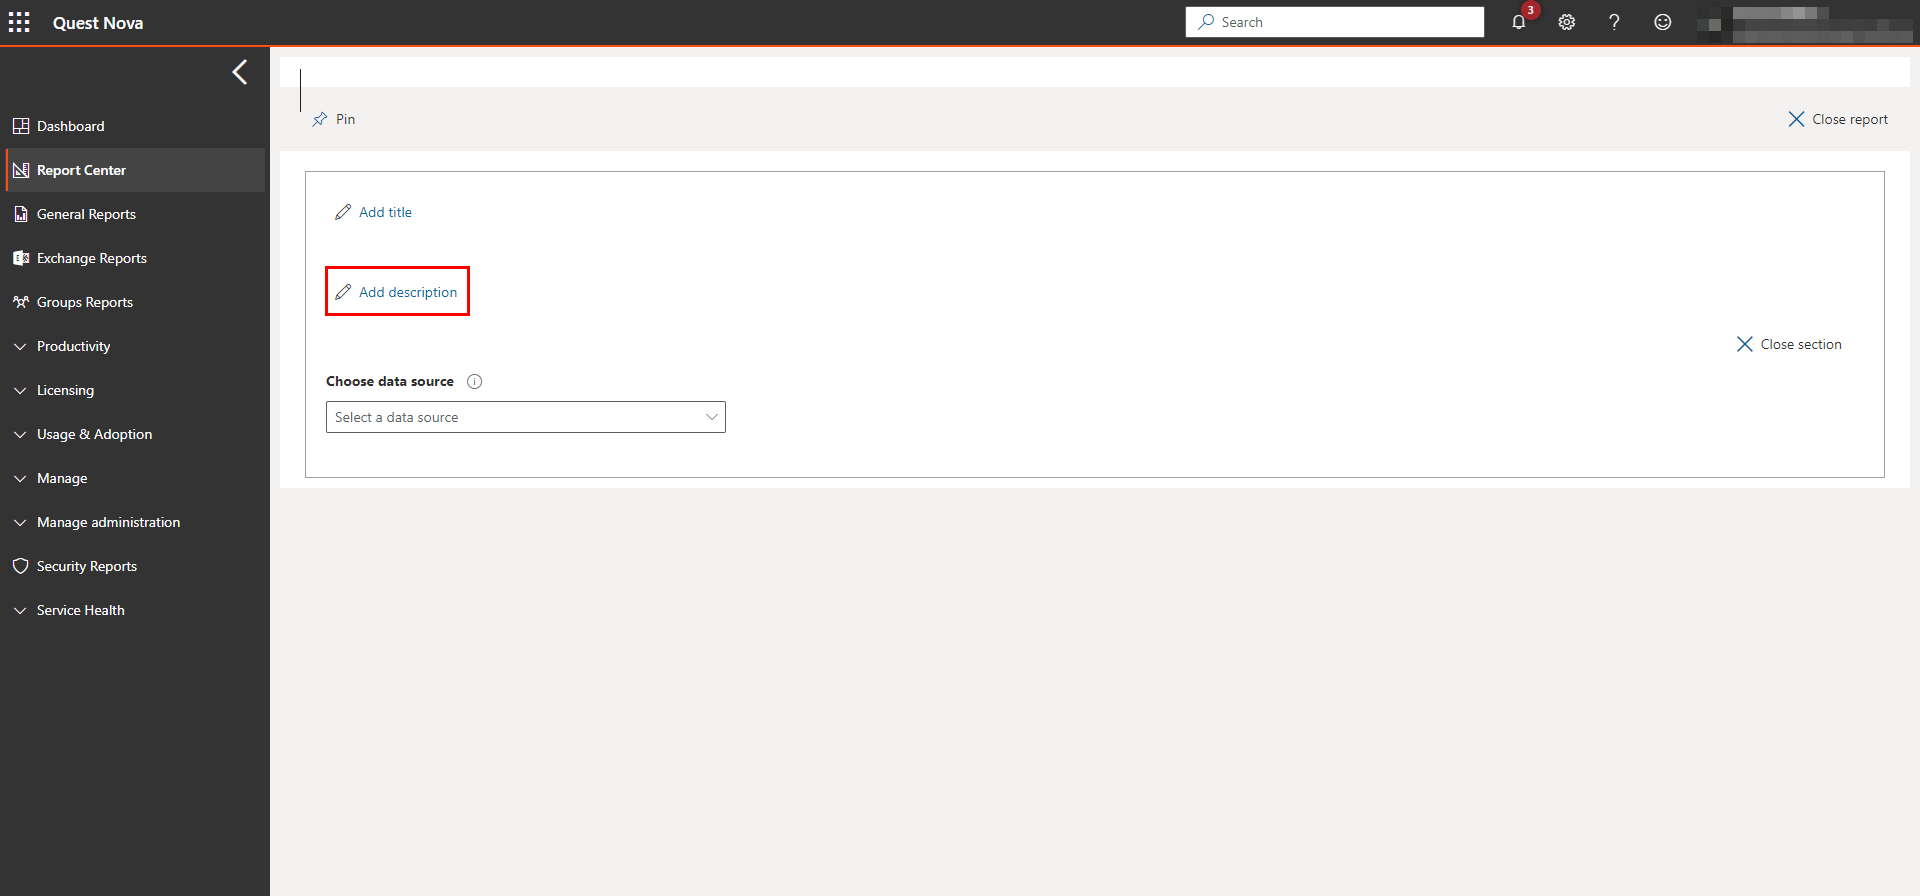
2.Then create a new section by clicking the plus icon.
3.Then click Edit section.
4.Now you can add both a title and a description to your section, as seen in the image below.
|
|
NOTE: If you are unsure about the title or description of your section, it is possible to create your section first then add a title and description after. |
Design tools
There is a range of tools to help your description stand out, including:
·bullet points and numbered lists
·hyperlinks to other pages or reports
·highlighting
and so on. The toolbar can be found here.
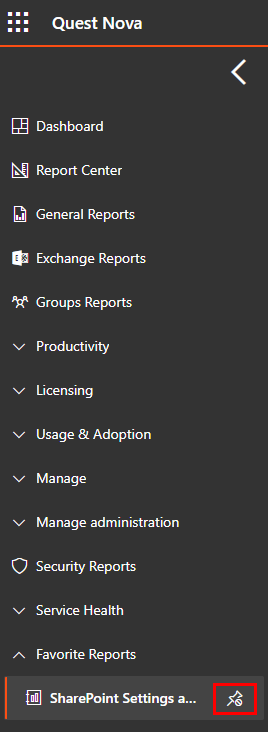
You can pin up to 5 reports to the navigation bar, for quicker access to frequently used or viewed reports.
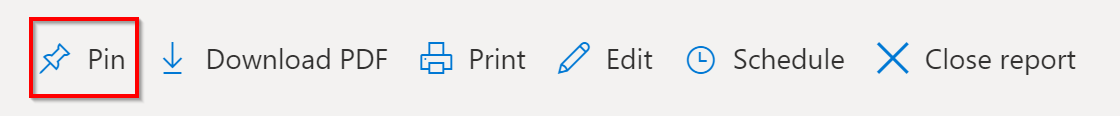
To pin reports, click on the report you want to pin.
In an unedited state, find and click on the Pin button.
The report then appears on the navigation bar on the left side of your screen.
To unpin a report, click the unpin button next to the report.