지금 지원 담당자와 채팅
지원 담당자와 채팅

NetVault 13.0.2 - Administration Guide for Managed Service Providers

Introduction Getting started Configuring clients Managing catalog search Configuring storage devices
About storage devices SAN considerations Quest DR Series systems Quest QoreStor NetVault SmartDisk EMC Data Domain Systems Snapshot Array Manager Virtual Tape Libraries Virtual standalone drives Shared Virtual Tape Libraries Physical tape devices Storage tiers
Backing up data Managing policies Restoring data Managing NetVault dashboard Managing jobs Monitoring logs Managing storage devices
Role-based access to manage storage devices Monitoring device activity Managing disk-based storage devices in list view Managing disk-based storage devices in tree view Managing the Snapshot Array Manager Managing tape libraries in list view Managing tape libraries in tree view Managing tape drives in list view Managing tape drives in tree view Adding shared devices
Managing storage media Managing user and group accounts Managing Tenant Monitoring events and configuring notifications Reporting in NetVault Working with client clusters Configuring default settings for NetVault
About configuring default settings Configuring encryption settings Configuring plug-in options Configuring default settings for post-scripts Configuring default settings for Verify Plug-in Configuring Deployment Manager Settings Configuring Job Manager settings Configuring Logging Daemon settings Configuring Media Manager settings Configuring Network Manager settings Configuring Process Manager settings Configuring RAS device settings Configuring Schedule Manager settings Configuring Web Service settings Configuring Auditor Daemon settings Configuring firewall settings Configuring general settings Configuring security settings Synchronizing NetVault Time Configuring the reporting utility Configuring NetVault WebUI default settings Configuring NetVault to use a specific VSS provider Configuring default settings using Txtconfig
Diagnostic tracing Managing diagnostic data Using the deviceconfig utility NetVault processes Environment variables Network ports used by NetVault Troubleshooting
Common errors Safe Mode in NetVault

Managing jobs

About Managing jobs

You can view and perform general job related actions and view the overall progress and status of the jobs. MSP administrator, Tenant administrator, and Tenant users can perform all job related actions. NetVault for MSP allows users to work in the respective scope. All these users can monitor the progress and control their tasks which are owned by the them.

Job activity capabilities

[NVBU-19856]

Different roles come with different rights and restrictions for view the job activity of other roles. The following lists describe the job activity capabilities for each role.

MSP administrator:

Tenant administrator:

Tenant user:

Viewing job activity

You can monitor the progress and status of your jobs from the Job Status page. You can also use this page to manage your jobs and perform various job-related tasks.

2
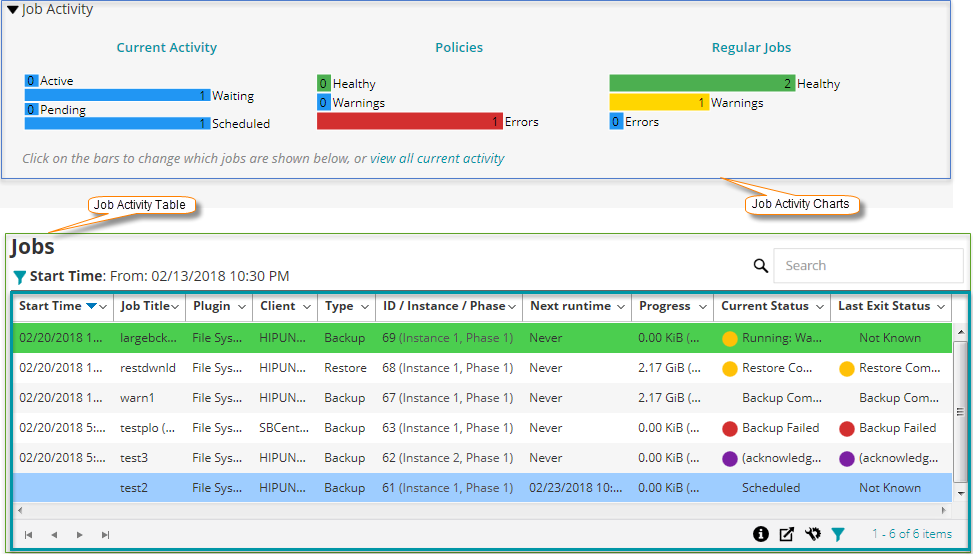
On the Job Status page, you can view the following information.
Figure 23. Job Status page

Table 73. Job Status page

Job activity charts

This area shows the summary for current jobs, policy jobs, and regular jobs in the form of bar charts:

Current Activity: The individual bars represent the number of jobs that are in active, waiting, pending, and scheduled states.
Policies: The individual bars represent the number of policy jobs that have completed successfully, completed with warnings, and failed. The Healthy count of policies shows the number of policy jobs that have completed successfully when all the jobs in the policy are successful. It shows 0 count if one or more jobs in the policy have warnings or errors.
Regular Jobs: The individual bars represent the number of regular jobs that have completed successfully, completed with warnings, and failed.

You can click a job activity to display the job details for that category in the job activity table. For example, you can click Policies in the Job Activity area to display the policy jobs in the job activity table.

You can click a bar in the activity chart area to display the job details for that category in the activity table. For example, you can click the Active bar in the Current Activity area to display the jobs that are in progress.

To return to the default view type for the activity table, click the View all current activity link.

To hide the job activity statistics on Job Status page, follow these steps:

In the header pane of NetVault WebUI, click the Settings icon and select Application Settings. Application Settings drawer is displayed on the right- side of the page.
In the Hide Job Statistics option, select Hide the Job Activity Statistics check box.

Job activity table

By default, the table lists all current job activities (All activity category).

For the All Activity category, you can view the following information: Start Time (also shows start date), Job Title, Plugin, Client, Type, ID/Instance/Phase (shows the instance and phase), Next runtime (date and time when the next instance is scheduled to run), Progress (current or average transfer rate), Current Status (current status of a job instance), and Last Exit Status (exist status of latest completed job instance).

You can also add or remove following additional columns using the column menu: Policy Name, ID (shows only the job ID), Instance (shows only the job instance), Phase (shows only the job phase), Selection Set, Plugin Options Set, Schedule Set, Source Set, Target Set, Advanced Options Set, Duration (Displays the time in hours: minutes: seconds to complete the operation for backup/restore/reporting). For more information, see Sorting records in NetVault WebUI.

The following job status light icons are displayed in the current status and last exit status columns based on the exit status:

Red light: Aborted, Died, Failed, Did not run
Yellow light: Warnings, Stopped, and Waiting for media
Violet: Acknowledged

The following row background colors are displayed for a job based on current status:

Green: Running
Blue: Scheduled

You can change the view type and also filter the records displayed in the table:

Change the view type: To view the job details for a different job category, click the corresponding bar in the activity chart area. For example, to view the jobs that have completed with warnings, click the Warnings bar in the Regular Jobs area.

To set the filter options (For more information on table filter options for Job Status page, see Table 7), view the page size setting, column sort order, applied filters in the table, export the records, or edit table settings, click the icons at the lower- right corner of the table.
4
You can use the Search option to filter the table data and quickly find entries that contain the specified string in any column values. You can also include wildcards (“?” or “*”) in the search filter string.
관련 문서

The document was helpful.

평가 결과 선택

I easily found the information I needed.

평가 결과 선택