지금 지원 담당자와 채팅
지원 담당자와 채팅

Foglight 5.9.5 - Dashboard Support Guide

About Dashboard Support Tools

Welcome to the Dashboard Support Guide. This guide describes the pages that you can use to evaluate your custom dashboards.

It describes the Tools and Dashboard Support page, explains how to view information about the data model, and shows you how to explore and publish the unit tests defined for module functions and queries. It contains information about exploring type and property definition inconsistencies, shows you how to view help identifiers per module, and explains where to find information on view usage in modules or sub-modules. Finally, it describes the process of viewing the amounts of data persisted to the database per dashboard, explains the concepts of data sources and their validation, and shows you how to review view error messages raised against one or more modules.

The Tools and Dashboard Support page is your starting point when you want to evaluate the dashboards you build for your monitored system. Use it to quickly assess the state of your dashboards and the underlying model, detect potential problems early on, and prevent unexpected behavior in the application.

Getting Started

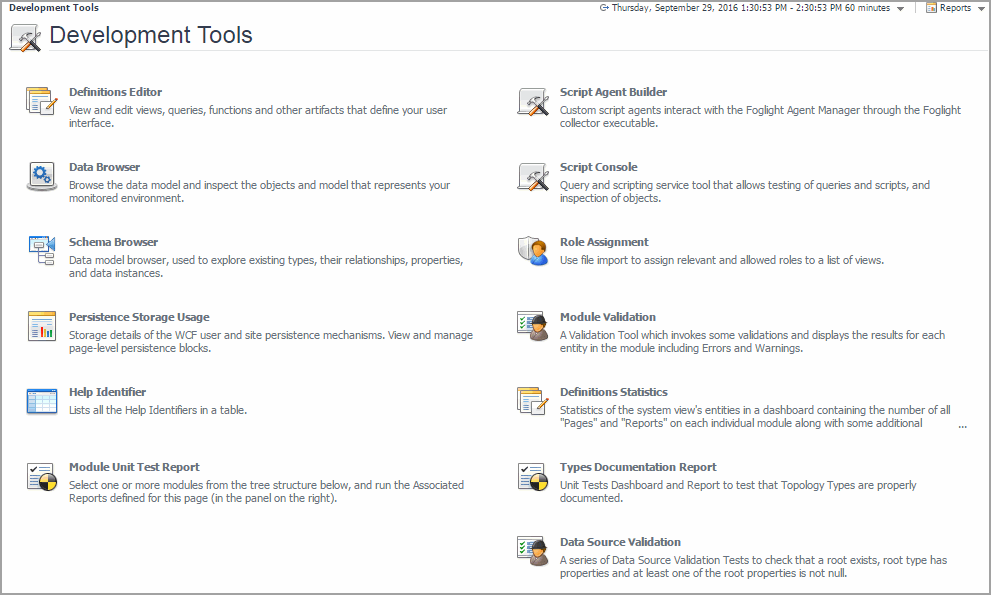
To access this dashboard, on the navigation panel, click Development Tools.

The Development Tools page contains links to dashboards that you can use to verify different aspects of your dashboards during the development cycle. For complete information, see the following :

Exploring the Data Model

Foglight® collects data from the monitored system and uses that data to dynamically build topology models at run-time. A topology model organizes the data in a way that represents the logical and physical relationship between items in your monitored environment and provides the context for the collected metrics.

Topology models consist of nodes, where each node is an instance of a topology object. The nature of the monitored environment dictates the structure and complexity of each topology model and the collection of available topology types. A basic server installation includes a set of core topology types, and each installed cartridge adds to that collection.

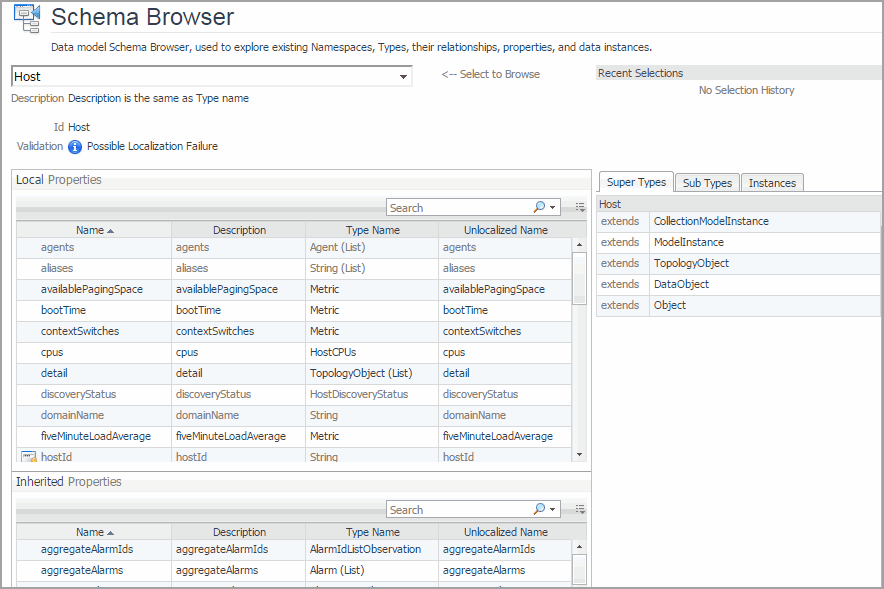
Use the Schema Browser to view information about the available data types, their relationships in the data model, properties, and object instances. This dashboard can help you better understand the data model structure.

Getting Started

To access this dashboard, on the Development Tools page, click Schema Browser.

Figure 1. Schema Browser

셀프 서비스 도구
지식 기반
공지 및 알림
제품 지원
소프트웨어 다운로드
기술 설명서
사용자 포럼
비디오 자습서
RSS 피드
문의처
라이센싱 지원가져오기
기술 지원
모두 보기
관련 문서

The document was helpful.

평가 결과 선택

I easily found the information I needed.

평가 결과 선택