Configuring Table Columns
In the preceding steps you gave the table a name and you have set its size, but you have not populated the table. In other words, you need to define the columns for the table.
|
2 |
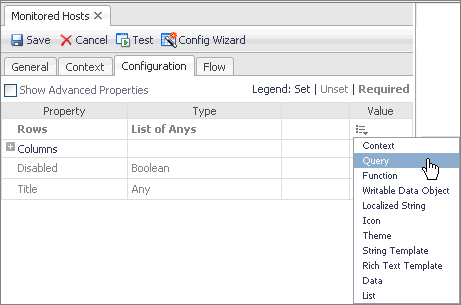
On the Configuration tab, ensure that the Show Advanced Properties check box is clear. The advanced properties are less likely to be used when constructing a basic version of the component which is what we are about to do in this procedure. |
The Edit - Rows dialog box appears.
|
4 |
In the Edit - Rows dialog box, in the Query box, click  drop-down list button, and in the navigation tree that appears, choose My Queries > Active Hosts. This is the query we created in Configuring a Query . |
|
6 |
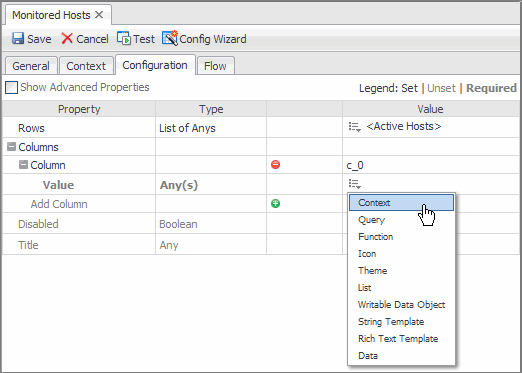
In the Property column, expand the Columns node, and then the Column node that appears immediately below. |
A Value node appears, along with an empty row with a Click to add button.
The Edit - Value dialog box opens.
|
9 |
In the Edit - Value dialog box, in the Input Key box, click  , and choose currentRow (Host) from the list that appears. |
|
10 |
In the Path box, click  , and choose Name - String from the list that appears. |
The Edit - Value dialog box closes.
|
12 |
Click Save to save your changes to the view. |
At this point you could continue to add columns, thus building a table that presents the data you want to see presented for each host. We leave the table for now and add more columns later.
Building the Dashboard
So far we have a query and a table to present some of the data that the query returns. Now we need to configure a dashboard. This gives us a container in which to place the table and other views that we might want to add later on.
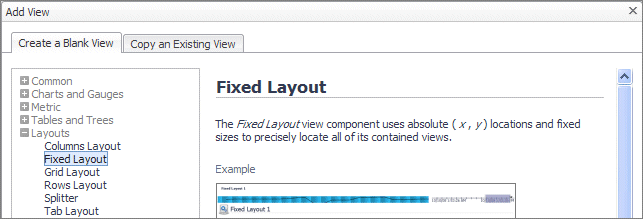
The Add View dialog box appears.
|
2 |
In the Add View dialog box, ensure that the Create a Blank View tab is selected. |
|
3 |
On the Create a Blank View tab, choose Layouts > Fixed Layout. |
|
7 |
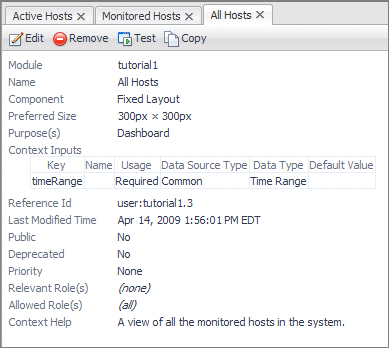
Set the Preferred Width and Preferred Height values. You can edit these values later when you have seen the table displayed, so you can choose any values you want. For now, set Preferred Width to 300 and Preferred Height to 150. |
On the right of Purpose, click Edit (

). In the dwell that appears, select
Dashboard, and leave all the other check boxes cleared. Since this view is a dashboard container, its purpose needs to reflect that to be enable access to it later on.
Click Apply in the dwell to save this change and close the dwell.
|
11 |
Leave the Custom Purpose(s), Relevant Role(s) and Allowed Role(s) values unchanged. |
|
12 |
Complete the Comments and Context Help boxes with any descriptive text, as required. |
|
13 |
Click Save to save your work so far. |
|
14 |
Click Edit to continue modifying the dashboard. |
Adding the Table to the Dashboard
By performing the steps in the preceding section you have created a dashboard and you have set its size, but as yet you have not added any components to it. It is just an empty container. First we will give the dashboard a title.
To do that you use the Configuration tab.
|
2 |
On the Configuration tab, locate the Title row, and in its Value column, click Edit  . |
The Edit - Title dialog box appears.
|
4 |
In the Edit - Title dialog box, in the Value box, type All Monitored Hosts, and click Set. |
The Add View dialog box appears.
|
7 |
In the Add View dialog box, select Select existing view, and click Next. |
The Add View dialog box refreshes.
|
8 |
In the View area, choose My Views > Monitored Hosts, and click Next. |
The Add View dialog box refreshes.
|
10 |
Click Finish. The Add View dialog box closes. |
|
11 |
Click Save to save the changes to the view. |
Summary
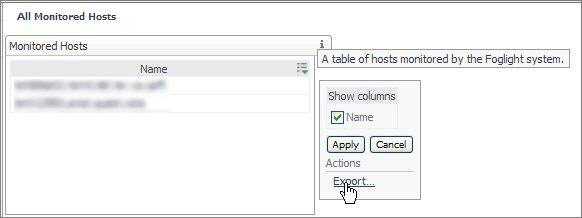
In this tutorial you have constructed a query, used it to populate the rows of a table, and presented that table in a fixed-layout view component that we are calling a dashboard.
You have viewed the component by navigating to All Hosts in the Dashboards area under My Definitions.
When you build a dashboard page with a real purpose in mind, you want to present some useful information about each host, such as the state of applications running on it, and to see if there are any alarms. You also want to add your newly-constructed page to a place that already exists in the browser interface. Also, you may want to furnish a drilldown page that contains extra information about a particular host that you select from the table. To accomplish that, you need to understand how to use context inputs and flows. These topics are covered in the next tutorial.

