Adding the views to the dashboard
As in Tutorial 2, the first step here is to give the dashboard a title.
|
1 |
Open the Configuration tab. |
|
2 |
In the Title row, in the Value column, click Edit |
|
3 |
|
4 |
For each of these parameters, in the Value column, click Edit |
|
• |
Input Key: host (Host) |
|
• |
Path: Name - String |
|
• |
Input Key: host (Host) |
|
• |
Path: Aggregate State - Integer |
|
6 |
Adding the views
|
1 |
Replicate the steps you performed to create Host Chooser DDL T3 in Tutorial 4 (see Configuring a Drop-Down List ), but this time name it Host Chooser DDL T4. Do not use the flow settings from Tutorial 4. |
|
2 |
|
3 |
Click the Selection row, and in the Edit - Selection dialog box that appears, clear the Leave unspecified check box. |
|
4 |
In the Edit - Selection dialog box, click the Flow type box, and choose Update from the list that appears. |
|
5 |
|
6 |
Click Save to close the Edit - Selection dialog box. In the view editor, click Save to save your changes to the Host Chooser DDL T4 view. |
|
1 |
|
2 |
Click Add. |
|
3 |
|
4 |
|
5 |
In the refreshed Add View dialog box, in the View area, choose My Views > Host Chooser DDL T4, and click Next. |
|
6 |
|
7 |
|
8 |
|
9 |
Click Finish to complete the layout of the Drop-Down List. |
|
1 |
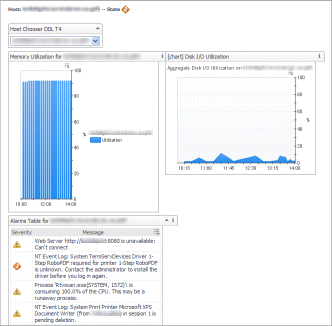
In a similar fashion, add the CPU Memory Utilization Chart T3 view to this dashboard. |
|
TIP: This chart appears listed under My Views. In case you do not see it there, ensure the chart is Public to see it as a layout choice. |
|
• |
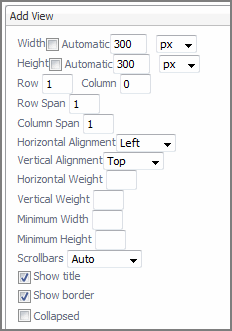
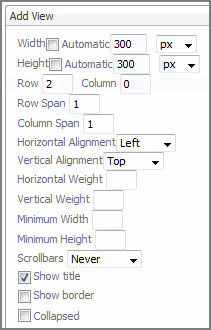
Use the same procedure to add the Alarm Table for Host T3 view from My Definitions using the following values to configure the layout settings for this view. |
|
TIP: This list appears listed under My Views. In case you do not see it there, ensure the list is Public to see it as a layout choice. |
The last component to be added is another chart. Rather than building the chart from scratch, copy an existing chart and place the copy in My Definitions.
|
1 |
By now, you should have a deep copy of the [chart] Disk I/O Utilization view from Hosts > Host. If you do not, save the grid, make a copy of the chart, and then resume editing the grid. |
|
2 |
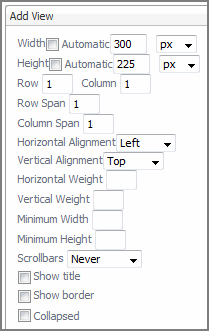
Add the [chart] Disk I/O Utilization view from My Definitions using the following values to configure the layout settings for this view. |
|
3 |
Click Save in the view editor to save your changes to the Hosts T4 dashboard. |
Adding a customizer
|
1 |
Open the Host T4 view for editing. |
|
2 |
Open the Configuration tab. |
|
3 |
|
4 |
Locate and expand the Customizer node. |
|
5 |
|
6 |
|
7 |
In the Icon row, in the Value column, click Edit |
|
8 |
|
9 |
In the Edit - Label dialog box that appears, in the String value box, type Customizer Test, and then click Set. |
|
10 |
Click Save in the view editor to save your changes to the Hosts T4 dashboard. |


