지금 지원 담당자와 채팅
지원 담당자와 채팅

Foglight Hybrid Cloud Manager 1.6 - User Guide (for AWS environments)

Summary - All EBS view

The Summary - All EBS view displays overall information for all EBS instances in the selected service and identifies the elements that consume the highest amount of resources. This view appears on the right when you select All EBS in the EBS view.

Figure 20. Summary - All EBS view

This view consists of the following embedded views:

Table 36. Alarms

Lists the alarms generated against the monitored EBS.

Alarm Message. An explanation about why the alarm occurred.
Severity. Indicates the alarm severity: Warning, Critical, or Fatal.
Time: Indicates when the alarm occurred.

Drill down on:

Alarm Message, Severity, or Time. Displays the Alarm Created dialog box, showing additional information about the alarm. For more information about alarms, see the Foglight User Help.
Table 37. Top Read Rate

Shows the top three EBS instances with the highest read rate.

Rate. The value of read rate (in B/s).
Volume. The name of the EBS instance.
Table 38. Top Write Rate

Shows the top three EBS instances with the highest write rate.

Rate. The value of write rate (in B/s).
Volume. The name of the EBS instance.
Table 39. Top Latency

Shows the top three EBS instances with the highest latency.

Time. The value of latency (in milliseconds).
Volume. The name of the EBS instance.
Table 40. Top IOPS

Shows the top three EBS instances with the highest IOPS.

Current. The value of IOPS (in c/s).
Volume. The name of the EBS instance.

EBS Summary view

The EBS Summary view displays complete details for an EBS instance. This view appears on the right when you select an EBS instance in the EBS view.

Figure 21. EBS Summary view

This view consists of the following embedded views:

Table 41. Alarms

Lists the alarms generated against the selected EBS instance.

Alarm Message. An explanation about why the alarm occurred.
Severity. Indicates the alarm severity: Warning, Critical, or Fatal.
Time. Indicates when the alarm occurred.

Drill down on:

Alarm Message, Severity, or Time. Displays the Alarm Created dialog box, showing additional information about the alarm. For more information about alarms, see the Foglight User Help.
Table 42. Related Items

Shows the numbers and states of the selected EBS instance running on the monitored AWS environment.

EC2 Instances. The number of the ECS2 instances that are associated with the selected account, followed by related alarm counts, broken down by the alarm state (Normal, Warning, Critical, Fatal).
Regions. The number of the regions that are that are associated with the selected account, followed by related alarm counts, broken down by the alarm state (Normal, Warning, Critical, Fatal).
Accounts. The number of the accounts that are that are associated with the selected region, followed by related alarm counts, broken down by the alarm state (Normal, Warning, Critical, Fatal).

Drill down on:

EC2 Instances. Displays the EC2 Instances Inventory dwell, showing the name and state of the associated Resource Groups.
Regions. Displays the Regions Inventory dwell, showing the name and state of the associated accounts.
Accounts. Displays the Other Items Inventory dwell, showing the name and state of the associated accounts.

Shows the resource utilization of the selected EBS instance, broken down into four simple views.

R/W Rate. Shows the total read/write bytes per second of the selected EBS instance.
Utilization. Shows the disk space utilization of the selected EBS instance.
Total Latency. Shows the total latency the selected EBS instance.
IOPS. Shows the IOPS of the selected EBS instance.

Explore - Volume view

The Explore - Volume view appears when you click Explore in the EBS Summary view.

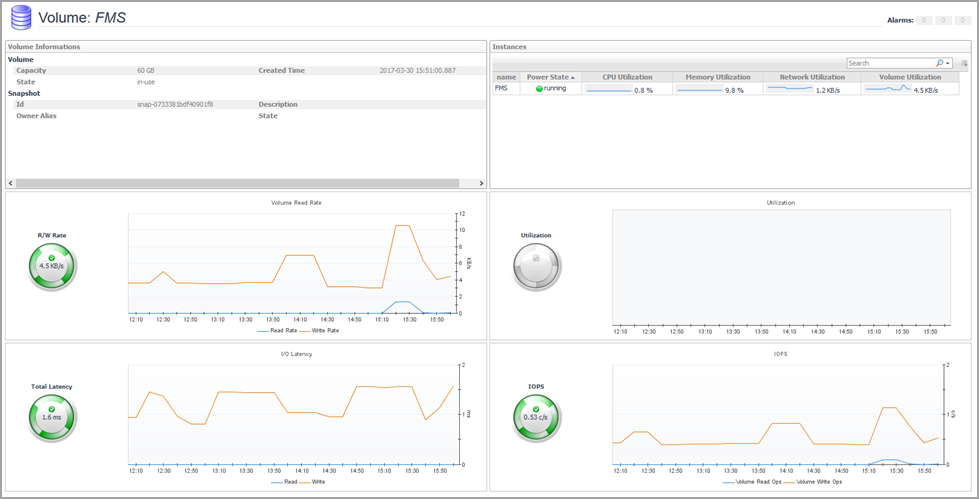
This view includes the following embedded views.


Shows the resource utilization of the selected EBS instance, broken down into four simple views.

R/W Rate. Shows the total read/write bytes per second of the selected EBS instance.
Utilization. Shows the disk space utilization of the selected EBS instance.
Total Latency. Shows the total latency the selected EBS instance.
IOPS. Shows the IOPS of the selected EBS instance.

Shows the volume, attachment, instance, and snapshot of the selected EBS instance.
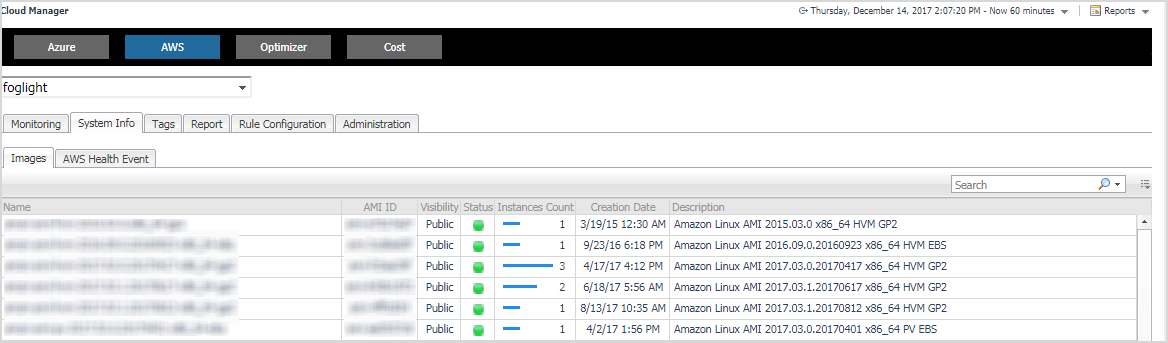
 

Table 46. Instance

Description

Shows the instance that use this volume, will show instance name, power state, CPU utilization, and so on.


System Info Tab

The System Info tab of the Cloud Manager dashboard contains the Images and AWS Health Event tables to help you understand the monitored AWS environment.

3
On the navigation panel, under Homes, click Cloud Manager.
The Cloud Manager dashboard opens.
4
Click System Info in the actions bar.
The System Info view opens on the bottom of Cloud Manager dashboard.

For more information, see the following topics:

Table 47. Images table
Name. Shows the image name.


AMI ID. Shows the image ID.


Visibility. Indicates whether the image is public or private.


Status. Indicates whether the image is available or pending.


Instances Count. Shows the total number of EC2 instances that are created by this Amazon Machine Image (AMI).


Creation Date. Indicates when this image is created.


Description. Shows the description of this image.


Name. Shows the event name.


Region. Indicates the region in which the event occurred.


Event Type. Indicates the event type.


Status. Indicates the event status.


Last Update. Shows the date when the event was last updated.


Description. Shows the event descriptions.


관련 문서

The document was helpful.

평가 결과 선택

I easily found the information I needed.

평가 결과 선택