지금 지원 담당자와 채팅
지원 담당자와 채팅

Foglight for SQL Server (Cartridge) 5.9.5.10 - User Guide

Introduction to this Guide Using Foglight for SQL Server
Viewing the Databases Dashboard Overview Dashboard Advisories Dashboard Monitoring Data Replication Monitoring SQL Performance Reviewing Memory Usage Reviewing the Instance Activity Reviewing Database Usage Reviewing the Services Using the HADR Drilldown Using the Logs Drilldown Reviewing Configuration Settings Viewing User-defined Performance Counters and Collections
Monitoring Business Intelligence Services Administering Foglight for SQL Server
Configuration Settings Managing Foglight for SQL Server Agent Settings Reviewing Foglight for SQL Server Alarms Generating Reports Monitoring SQL Server instances on VMware servers
Glossary
A
Access methods Adhoc SQL Plans Alarm Alert Allow updates Anonymous subscription Authentication AutoClose AutoGrow Automatic Discovery AutoShrink B Batch BCP (Bulk Copy Program) Blocking Books Online Bound trees Buffer Buffer cache Buffer pool Bulk copy Bulkinsert Bulk load C Cache CAL Calibration Cardinality Cartridge Chart Checkpoint process Client network utility CLR Compile Connect Connection Connectivity software CPU Usage Cursors D Data access components Data file Data storage engine Database Database object DataFlow DBCC DBID DBO Deadlock Disk queue length Disk transfer time Disk utilization DiskPerf Distributing instance Distributor DMO Drilldown DTC DTS E Error log Event alert Execution contexts Extended stored procedures Extent External procedures F File Filegroup File cache Foglight Agent Manager Foglight Management Server Foreign key Forwarded records Free buffers Free list Free pages Free potential Free space Freespace scans Full text search G GAM Ghosted records Growth increment GUID H Hash buckets Hashing Heap Hit rate Hit ratio Host name Host process I I/O Index Indid Integrated security Intent Locks J Job K Kernel memory Kernel mode Kill L Latch Lazy writer Licensing Lightweight pooling Lock Lock area Lock escalation Lock mode Log Log cache Log writer Logical I/O LRU LSN M Master MaxSize MDAC Metric Misc.normalized trees Model Monitor page file N Named pipes Net library NIC Null O OBID Object plans OLAP OLAP service OLTP Optimizer Optimizer cache osql P Page life expectancy Paging Panel Parse Parser Per seat licensing Per server licensing Performance alert Physical I/O Physical read Physical write PID Pinned Plan Plan cache Potential growth Prepared SQL plans Primary key Privileged mode Procedure cache Procedure plans Process Profiler Publication database Publisher Publisher databases Publishing server Pull subscription Pulse Push subscription Q Query plan R RAID Random I/O Read ahead Recompile Referential integrity Relational data engine Replication procedure plans Role Rollback S sa Schema locks Sequential I/O Session Severity SGAM Shared locks Show advanced options SMP Sort, Hash, Index Area SPID Spike Spinner SQL Agent Mail SQL Mail SQL Plans SQL Server Agent SQL Server authentication SQL Server books online Standard deviation Stolen pages Stored procedure Support service SYSADMIN role T TDS TempDB Temporary tables and table variables Threshold Torn page detection Transaction Trigger Trigger plans Truncate Trusted U UMS Unused space User connection area User mode V Virtual log file VLF W Waitfor Windows authentication mode Working set
Reference
SQL PI Repository Cold Backup Procedure SQL Performance Investigator Metrics
Active Time All SQL Agents CPU Usage All SQL Agents Resident Memory Usage Availability Average Physical I/O Operations Average SQL Response Time Backup Recovery Wait Blocked Lock Requests Checkpoint Pages CLR Wait CPU Usage CPU Wait Cursor Synchronization Wait Database Replication Wait Deferred Task Worker Wait Degree of Parallelism Disk Utilization DTC CPU Usage DTC Resident Memory Usage Distributed Transaction Wait Executions Ended Executions Started External Procedures Wait Full Scans Full Text Search CPU Usage Full Text Search Resident Memory Usage Full Text Search Wait Free Buffer Wait Hosted Components Wait IO Bulk Load Wait IO Completion Wait IO Data Page Wait IO Wait Latch Buffer Wait Latch Wait Latch Savepoint Wait Lazy Writes Lock Wait Lock Bulk Update Wait Lock Exclusive Wait Lock Intent Wait Lock Requests Lock Schema Wait Lock Shared Wait Lock Update Wait Lock Wait Log Buffer Wait Log Flushes Log Other Wait Log Synchronization Wait Log Wait Log Write Wait Memory Wait Network IO Wait Network IPC Wait Network Mirror Wait Network Wait Non SQL Server CPU Usage Non SQL Resident Memory Usage OLAP CPU Usage OLAP Resident Memory Usage OLEDB Provider Full Text Wait Other CPU Usage Other Miscellaneous Wait Other Wait Overall CPU Page Life Expectancy Page Splits Parallel Coordination Wait Physical I/O Physical Memory Used Physical Page Reads Physical Page Writes Probe Scans Plan Cache Hit Rate Range Scans Rec Ended Duration Remote Provider Wait Run Queue Length Samples Service Broker Wait Session Logons Session Logoffs SQL Agent CPU Usage SQL Agent Resident Memory Usage SQL Executions SQL Mail CPU Usage SQL Mail Resident Memory Usage SQL Recompilations SQL Response Time SQL Server Background CPU Usage SQL Server Cache Memory SQL Server Connections Memory SQL Server Connections Summary SQL Server Foreground CPU Usage SQL Server Resident Memory Usage SQL Server Swap Memory Usage Synchronous Task Wait Table Lock Escalation Target Instance Memory Total CPU Usage Total Instance Memory Virtual Memory Used
Rules Collections and Metrics
SQL Server Agent's Default Collections Access Methods Agent Alert List Agent Job List Always On Availability Groups Backup Locations Blocking History Blocking List Buffer Cache List Buffer Manager CLR Assemblies Cluster Summary Configuration Database Index Density Vectors Database Index Details Database Index Fragmentation Info Database Index Histogram Database Index List Database Information Database Properties Database Sessions (Session List) Database Summary Database Tables List Databases Deadlock DTC Information Error Log Error Log List Error Log Scan File Groups File Data Flow Statistics File Groups Files Files Drive Total Files Instance Summary Full Text Catalog InMemory OLTP (XTP) Instance Wait Categories Instance Wait Events Job Messages Latches and Locks Lock Statistics Locks List Log Shipping Log Shipping Error Logical Disks Memory Manager Mirroring Mirroring Performance Counters Missing Indexes Plan Cache Distribution Plan Cache List Replication Agents Replication Agent Session Actions Replication Agent Session Merge Articles Replication Agent Sessions Replication Agent Sessions by Type Replication Available Replication Publications Replication Subscriptions Reporting Services Resource Pool Session Data Session Trace SQL PI Instance Statistics SQL Server Connections Summary SQL Server Global Variables SQL Server Host SQL Server Load SQL Server Services SQL Server Throughput SQL Server Version Info SSIS OS Statistics SSIS Summary Statistics Top SQLs Top SQL Batch Text Top SQL Long Text Top SQL Plan Top SQL Short Text Top SQL Summary Traced SQL PA Usability User-defined Performance Counters User-defined Queries Virtualization XTP Session Transactions Statistics

Reviewing SQL Server Activity for a Specific Instance

The SQL Server Activity view is displayed by clicking a specific instance under the SQL Servers section.

This view allows carrying out the tasks described in the following sections:

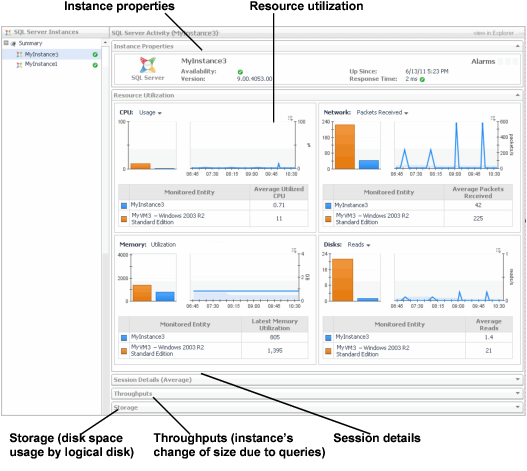
The Instance Properties section contains the following components:

The Resource Utilization section displays the instance’s utilization of the following resource types: CPU, Network, Memory, and Disk I/O.

For each of the sections, whenever there is an equivalent metric in the Virtual Machine topology, a bar chart is displayed, comparing the average between the period values of the SQL Server instance and the Virtual Machine metrics. The chart displays the selected metric’s values throughout the specified time range, and the table displays the metric’s average value.

Except Memory, the utilization of each resource category can be seen using several metrics, as listed below.

The Session Details (Average) section displays the following summarized data:

The throughputs section contains two bars, which display the instance’s accumulated change of size caused by running SQL queries of the type selected from the Query Type list (Insert, Update, Delete, Select, or All) during the specified time range. The size change is shown using the following indicators:

The Storage section displays, for each of the logical disks, storage-related data about the disk space allocation and utilization by the virtual machine and the SQL Server instance. Virtual machine-related data is retrieved using vFoglight, while SQL Server instance-related data is retrieved using Foglight for SQL Server. Data is displayed in a graphic (bar) and textual formats.

The Disk Space Utilization bar displays the space breakdown of the logical disk into the following categories:

The Virtual Machine section displays the following data regarding the virtual machine’s disk space utilization:

The Database section displays the following data regarding the SQL Server instance’s disk space utilization:


Glossary

A functional module within SQL Server that is responsible for managing the retrieval and modification of data and index pages.

A

A functional module within SQL Server that is responsible for managing the retrieval and modification of data and index pages.

Access methods

A functional module within SQL Server that is responsible for managing the retrieval and modification of data and index pages.

관련 문서

The document was helpful.

평가 결과 선택

I easily found the information I needed.

평가 결과 선택