지금 지원 담당자와 채팅
지원 담당자와 채팅

Foglight for SQL Server (Cartridge) 5.9.5.10 - User Guide

Introduction to this Guide Using Foglight for SQL Server
Viewing the Databases Dashboard Overview Dashboard Advisories Dashboard Monitoring Data Replication Monitoring SQL Performance Reviewing Memory Usage Reviewing the Instance Activity Reviewing Database Usage Reviewing the Services Using the HADR Drilldown Using the Logs Drilldown Reviewing Configuration Settings Viewing User-defined Performance Counters and Collections
Monitoring Business Intelligence Services Administering Foglight for SQL Server
Configuration Settings Managing Foglight for SQL Server Agent Settings Reviewing Foglight for SQL Server Alarms Generating Reports Monitoring SQL Server instances on VMware servers
Glossary
A
Access methods Adhoc SQL Plans Alarm Alert Allow updates Anonymous subscription Authentication AutoClose AutoGrow Automatic Discovery AutoShrink B Batch BCP (Bulk Copy Program) Blocking Books Online Bound trees Buffer Buffer cache Buffer pool Bulk copy Bulkinsert Bulk load C Cache CAL Calibration Cardinality Cartridge Chart Checkpoint process Client network utility CLR Compile Connect Connection Connectivity software CPU Usage Cursors D Data access components Data file Data storage engine Database Database object DataFlow DBCC DBID DBO Deadlock Disk queue length Disk transfer time Disk utilization DiskPerf Distributing instance Distributor DMO Drilldown DTC DTS E Error log Event alert Execution contexts Extended stored procedures Extent External procedures F File Filegroup File cache Foglight Agent Manager Foglight Management Server Foreign key Forwarded records Free buffers Free list Free pages Free potential Free space Freespace scans Full text search G GAM Ghosted records Growth increment GUID H Hash buckets Hashing Heap Hit rate Hit ratio Host name Host process I I/O Index Indid Integrated security Intent Locks J Job K Kernel memory Kernel mode Kill L Latch Lazy writer Licensing Lightweight pooling Lock Lock area Lock escalation Lock mode Log Log cache Log writer Logical I/O LRU LSN M Master MaxSize MDAC Metric Misc.normalized trees Model Monitor page file N Named pipes Net library NIC Null O OBID Object plans OLAP OLAP service OLTP Optimizer Optimizer cache osql P Page life expectancy Paging Panel Parse Parser Per seat licensing Per server licensing Performance alert Physical I/O Physical read Physical write PID Pinned Plan Plan cache Potential growth Prepared SQL plans Primary key Privileged mode Procedure cache Procedure plans Process Profiler Publication database Publisher Publisher databases Publishing server Pull subscription Pulse Push subscription Q Query plan R RAID Random I/O Read ahead Recompile Referential integrity Relational data engine Replication procedure plans Role Rollback S sa Schema locks Sequential I/O Session Severity SGAM Shared locks Show advanced options SMP Sort, Hash, Index Area SPID Spike Spinner SQL Agent Mail SQL Mail SQL Plans SQL Server Agent SQL Server authentication SQL Server books online Standard deviation Stolen pages Stored procedure Support service SYSADMIN role T TDS TempDB Temporary tables and table variables Threshold Torn page detection Transaction Trigger Trigger plans Truncate Trusted U UMS Unused space User connection area User mode V Virtual log file VLF W Waitfor Windows authentication mode Working set
Reference
SQL PI Repository Cold Backup Procedure SQL Performance Investigator Metrics
Active Time All SQL Agents CPU Usage All SQL Agents Resident Memory Usage Availability Average Physical I/O Operations Average SQL Response Time Backup Recovery Wait Blocked Lock Requests Checkpoint Pages CLR Wait CPU Usage CPU Wait Cursor Synchronization Wait Database Replication Wait Deferred Task Worker Wait Degree of Parallelism Disk Utilization DTC CPU Usage DTC Resident Memory Usage Distributed Transaction Wait Executions Ended Executions Started External Procedures Wait Full Scans Full Text Search CPU Usage Full Text Search Resident Memory Usage Full Text Search Wait Free Buffer Wait Hosted Components Wait IO Bulk Load Wait IO Completion Wait IO Data Page Wait IO Wait Latch Buffer Wait Latch Wait Latch Savepoint Wait Lazy Writes Lock Wait Lock Bulk Update Wait Lock Exclusive Wait Lock Intent Wait Lock Requests Lock Schema Wait Lock Shared Wait Lock Update Wait Lock Wait Log Buffer Wait Log Flushes Log Other Wait Log Synchronization Wait Log Wait Log Write Wait Memory Wait Network IO Wait Network IPC Wait Network Mirror Wait Network Wait Non SQL Server CPU Usage Non SQL Resident Memory Usage OLAP CPU Usage OLAP Resident Memory Usage OLEDB Provider Full Text Wait Other CPU Usage Other Miscellaneous Wait Other Wait Overall CPU Page Life Expectancy Page Splits Parallel Coordination Wait Physical I/O Physical Memory Used Physical Page Reads Physical Page Writes Probe Scans Plan Cache Hit Rate Range Scans Rec Ended Duration Remote Provider Wait Run Queue Length Samples Service Broker Wait Session Logons Session Logoffs SQL Agent CPU Usage SQL Agent Resident Memory Usage SQL Executions SQL Mail CPU Usage SQL Mail Resident Memory Usage SQL Recompilations SQL Response Time SQL Server Background CPU Usage SQL Server Cache Memory SQL Server Connections Memory SQL Server Connections Summary SQL Server Foreground CPU Usage SQL Server Resident Memory Usage SQL Server Swap Memory Usage Synchronous Task Wait Table Lock Escalation Target Instance Memory Total CPU Usage Total Instance Memory Virtual Memory Used
Rules Collections and Metrics
SQL Server Agent's Default Collections Access Methods Agent Alert List Agent Job List Always On Availability Groups Backup Locations Blocking History Blocking List Buffer Cache List Buffer Manager CLR Assemblies Cluster Summary Configuration Database Index Density Vectors Database Index Details Database Index Fragmentation Info Database Index Histogram Database Index List Database Information Database Properties Database Sessions (Session List) Database Summary Database Tables List Databases Deadlock DTC Information Error Log Error Log List Error Log Scan File Groups File Data Flow Statistics File Groups Files Files Drive Total Files Instance Summary Full Text Catalog InMemory OLTP (XTP) Instance Wait Categories Instance Wait Events Job Messages Latches and Locks Lock Statistics Locks List Log Shipping Log Shipping Error Logical Disks Memory Manager Mirroring Mirroring Performance Counters Missing Indexes Plan Cache Distribution Plan Cache List Replication Agents Replication Agent Session Actions Replication Agent Session Merge Articles Replication Agent Sessions Replication Agent Sessions by Type Replication Available Replication Publications Replication Subscriptions Reporting Services Resource Pool Session Data Session Trace SQL PI Instance Statistics SQL Server Connections Summary SQL Server Global Variables SQL Server Host SQL Server Load SQL Server Services SQL Server Throughput SQL Server Version Info SSIS OS Statistics SSIS Summary Statistics Top SQLs Top SQL Batch Text Top SQL Long Text Top SQL Plan Top SQL Short Text Top SQL Summary Traced SQL PA Usability User-defined Performance Counters User-defined Queries Virtualization XTP Session Transactions Statistics

Monitoring Log Files

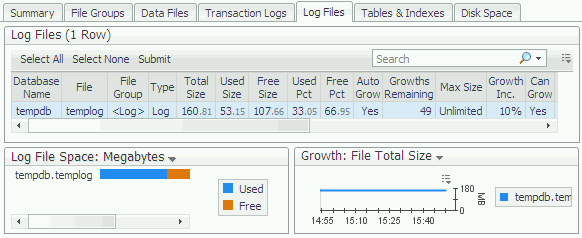
The Log Files pane displays detailed information about all log files in the database currently selected in the Databases table.

Figure 23. The Log Files pane.

This pane includes the following areas:

Table 43. The Log Files table displays information about all log files in the selected database.

The log file name.

The name of the file group to which the file belongs.

The log file type.

The size of the log file.

The amount of the used space in the log file.

The size of the currently unused space in the log file.

The percentage of used space within the log file.

The percentage of space available for use within the log file.

Determines whether the log file can grow automatically.

The number of times the file can AutoGrow before it can grow no more.

The maximum size to which the log file can grow.

Growth increment. The amount by which the log file can AutoGrow at any one time.

Determines whether the log file can grow.

The log file’s path.

The database name, concatenated with the log file name.

The Log Files Space chart displays the total space allocated to each log file.

The chart values can be displayed in megabytes or as a percentage of disk space. Use the Log File Space list to change the values displayed on the chart.

The Log File Growth chart shows the amount by which each log file is growing over time.

Use the Growth list to change the values displayed on the chart. This list can be displayed by the total amount of space (Total), used space (Used), or unused space (Free space).

Monitoring Tables and Indexes

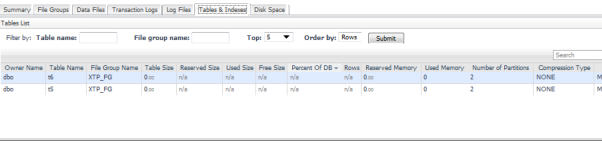
The Tables and Indexes pane, which displays storage information for database tables and indexes, contains the following sections:

The Table list displays all tables in the selected database, including data such as their size, number of rows, free space, and owner name.

Optionally — To filter the display, proceed to Step 4. To display the entire list according to the parameters set now, go to Step 5.
3
Use the File Group Name field to display only tables belonging to a specific file group.
4
Use the Table Name field to display either a specific table, by entering its exact name, or all tables that share a character string (for example, product), by entering that string.
5
Click Submit.

To create a custom filter for this table, use the options accessible by clicking the Customizer button at the table’s upper right side. For details, see Components Shared by all Foglight for SQL Server Screens .

The value displayed in the Table Size column indicates only the amount of space used by data, while the value displayed in the Used Size column indicates the amount of space used by both data and indexes, and the value displayed in the Reserved Size column indicates the entire amount of space reserved for data and indexes.

The name of the table owner.

The name of the table.

The name of the file group where the table is stored.

The actual size of the table, in megabytes.

The amount of space reserved for the table, in megabytes.

The amount of used space in the table, in megabytes.

The amount of free space in the table.

The percentage of space that the table occupies in the database.

The number of rows in the table.

The amount of memory reserved for this table.

The amount of memory used by this table.

The number of partitions, if any.

What type of compression the table uses, if any.

The type of table. Memory optimized, user tables and File tables are now included.

The Indexes table shows the index statistics for all indexes in the selected tables. SQL Server stores statistics about the distribution of the key values in each index, and uses these statistics to determine which indexes to use in query processing.

Selecting a single row in the Indexes table displays detailed index statistics for that index in the lower section of the drilldown.

To create a custom filter for this table, use the options accessible by clicking the Customizer button at the table’s upper right side. For details, see Components Shared by all Foglight for SQL Server Screens .

The owner of the index.

The table that the index is associated with.

The name of the index.

The ID of the index.

The name of the File Group where the index resides.

The type of the index.

The number of keys in the index.

The size of the index at the time of its last statistics update, measured in megabytes.

The amount of used space in the index, in megabytes.


The amount of free space in the index, in megabytes.


The number of rows in the table.

The number of row modifications made since statistics were last updated for this index.

The fill factor used when creating an index, in order to reserve a percentage of free space on each data (leaf level) page.

This table allows selecting one or more indexes. When only one index is selected, its distribution statistics are displayed at the bottom part of the drilldown. When multiple indexes are selected, statistics are displayed only for the index with cursor focus (indicated by a black box around the index row).

Clicking a single index in the Indexes table displays the Index Properties pop-up.

The Index Properties pop-up contains the tables described in the following sections:

The Index Density table shows the density values for each combination of columns in the index.

The name of the columns in the index.

Density is the term used by SQL Server to represent the selectivity of the index columns. The more selective an index is, the more useful it is in searches.

Density is calculated as 1 / distinct values for all values in the first key column of the statistics object, excluding the histogram boundary values.

Average number of bytes per value for all of the key columns in the statistics object.

The Fragmentation table displays all indexes in the selected tables and shows the latest fragmentation information collected for each index.

Fragmentation information is collected by running the DBCC SHOWCONTIG command on each selected index.

For information about the Fragmentation statistics displayed on the Fragmentation page, see the DBCC SHOWCONTIG topic in the Transact-SQL Reference section in the Microsoft® SQL Server Books Online.

The following values can be used for determining the overall fragmentation in tables:

Extent Scan Fragmentation and Logical Scan Fragmentation are expressed as percentage values.
Average Page Density shows how full each page is. This is affected by the FILL FACTOR setting used when creating the index; for example, immediately after creating an index with a FILL FACTOR of 30, the Average Page Density for that index is 30. This value is then change as data in the table is modified. Average Page Density can be thought of as the “real” fill factor at the time the data was collected, as opposed to the “original” fill factor that was specified when the index was created. The Original Fill Factor is used when an index is created to leave free space in index pages to allow for the insertion of new records without having to split the page.
Fill Factor Variance is a computed metric, used for comparing the Average Page Density with the original fill factor used when creating the index. The value of this metric is calculated as the absolute difference between the average page density (AvgPage Density) and Original Fill Factor. The value of this variance shows how much the fill factor of the index has changed since the index was created.
Scan Density is a value computed by dividing the optimal number of extent switches by the actual number of extent switches. It is expressed as a percentage value, where higher values indicate less fragmentation. Scan density is displayed with a value of -1 for tables that reside on more than one file.

Several options are available for eliminating (or at least reducing) fragmentation. In general, fragmented indexes should be rebuilt by SQL Server. For details, see Microsoft® SQL Server Books Online.

When a single index is selected in the Indexes table, the Index Distribution chart displays the index distribution histogram for the selected index.

When SQL Server collects statistics on an index for use in determining the indexes usefulness for resolving queries, it samples the data in the index and produces a histogram of the key values found. This chart shows that histogram for the selected index.

The values shown in the Index Distribution chart derive from the latest statistics for the selected index. If the index statistics are out of date, these values are also outdated. Check the Last Updated statistic on the Statistics page for the date when statistics were last collected. Use the Update Statistics SQL command to re-collect statistics.

Each series in the chart corresponds to one sample value from the first column in the index. The chart shows the number of rows in the table that have that value.

If the selected index is on a Name column, the chart may display the following values:

This means that five of the people have a name that is alphabetically before or equal to ABRAHAM, 20 people are between ABRAHAM and GEORGE, 25 people are between GEORGE and PETER, and so on.

This chart can be used for identifying skewed indexes, that is, indexes that have a very uneven distribution of data. For example, if 95% of the table has the same value for a key, it is difficult for SQL Server to determine if it is useful index. Searches on values that fall in the 5% might find the index very useful, but searching on the value that occurs 95% of the time are not so useful.

Monitoring Disk Space

The Disk Space pane displays storage information about disks that reside on the currently monitored server.

The term disk in this tab is used on the assumption that each physical disk contains only one partition. If the disk is divided to several partitions (logical drives), the tab displays disk space utilization per partition, and not a summary of the utilization of the entire physical drive.

This pane is designed to answer the following questions:

This pane features the Disk Space chart, which displays each disk on the server. The display is divided into SQL Data files, SQL Log files, Non-SQL files or Free Space. This chart allows to easily view how much of each disk is used by SQL databases, and how much is free.

The amount of space on the disk used by data files in the currently monitored SQL Server databases.

The amount of space on the disk allocated to data files in the currently monitored SQL Server databases but not used.

The amount of space on the disk allocated to SQL Server log files for the currently monitored databases.

The amount of space on the disk allocated to log files in the currently monitored SQL Server databases but not used.

The amount of space on the disk not used by any files.

The amount of space on the disk used by files not associated with the currently monitored SQL Server databases.

To include the Disk Free and the Non SQL files parameters on the chart, select the box Include Non-SQL files in the chart.

To restrict the data and log-related figures to display only the space used by specific databases, select one or more of the databases in the Databases table.

To choose whether to display the chart in megabytes (MB) or percentage, use the Disk Space Utilization drop-down list box.

If the Windows server being monitored does not have Logical Disk performance counters enabled, the value of the Non-SQL Files component of this chart is always zero. If disk counters are not enabled, the Disk Counters Disabled alarm is displayed on the home page. To enable disk counters, it is advisable to run the exctrlst.exe utility, provided by Microsoft.

To use the exctrlst.exe utility:
2
Double-click the exctrlst.exe binary file, to display the Extensible Counter List dialog box.

Monitoring TempDB Status

The TempDB system database is a global resource that exists in any SQL Server instance and is used for various functions within it. There is one such database in every instance.

It is used to hold the following:

Given its wide range of usage and the fact that there is only one such database in any instance, it may become a bottleneck. The TempDB dashboard aim is to help analyze TempDB activity and diagnose potential problems.

The upper pane of the dashboard indicates the amount of space currently allocated across all data files of the TempDB database as well as its log files.

The usage profile graph indicates how space is used within TempDB so it is possible to see which component is allocated the majority of the space: user objects, internal objects or the version store.

The usage profile tab on the lower pane of the screen, provides more information about the usage trends of TempDB. The left side indicates how space is allocated between the various consumers of TempDB both at the database level and at the file level. To find out which tables are currently allocated within TempDB use the Tables & Indexes tab.

The Right side provides more information about the version store usage.If you see the version store consume a considerable amount of space in the TempDB, check the generation rate compared to the cleanup rate. A high generation rate that is not matched by the cleanup rate may indicate data modification transactions are not committing frequently enough. The "Current Transaction Running Time" indicates the running time of the longest transaction.

To find out more about sessions that are currently allocating space in TempDB, use the Sessions tab. The TempDB Current Allocated Size metric indicate the amount of space (MB) currently allocated by the session and not yet deallocated. The TempDB Total Allocated Size metric indicates the amount of space (MB) that the session has used since it started.

More details about the session can be found by drilling down to the Session dashboard using the link on the SPID column.

The Create Objects Rate graph, on the upper pane of the dashboard, can be used to determine the trend of user objects creation rate. If this number is high or deviates from its normal behavior it may indicate misuse of temporary objects.

The Summary tab, on the lower pane, can be used to examine rate of transactions against TempDB.

Wait for IO on TempDB files, as well as contention for allocation pages, can be examined in the SQL Performance dashboard if SQL PI is installed

관련 문서

The document was helpful.

평가 결과 선택

I easily found the information I needed.

평가 결과 선택