지금 지원 담당자와 채팅
지원 담당자와 채팅

Foglight for Infrastructure 5.9.5 - Infrastructure Utilities User Guide

Monitoring Web transactions Monitoring network devices

Alarms view

The Alarms view lists the alarms generated against the selected object or group of objects in the Quick View.

2
On the Monitor tab, in the Net Monitor Environment view, select the Network Devices or Locations tile.
3
In the Quick View, in the panel on the left, select All Network Devices, a network device, or a monitoring location.
The Alarms view appears at the bottom of the panel on the right.
Table 5. Alarms view
Alarm Message. The alarm message, explaining the reason for this alarm.
Device Name. The name of the monitored device against which the alarm is generated.
Monitor Location. The name of the host running the instance of the Net Monitor Agent that monitors this device.
Severity. Indicates the alarm severity: Warning , Critical , or Fatal .
Time. The time at which the alarm is generated.

Device Detail view

The Device Detail view provides details about the selected network device. Use it to find out the average response times of this device from different monitoring locations, and to review its overall health.

2
On the Monitor tab, in the Net Monitor Environment view, select the Network Devices tile.
3
In the Quick View, in the Network Devices view, select a network device.
The Device Detail view appears in the display area.

This view is made up of the following embedded views:

Lists the hosts from which the selected network device is monitored.

Availability. A color-coded bar, representing the availability of the device over the selected time range. The color of the bar changes depending on the alarm state. Red indicates the Fatal state, orange indicates Critical, yellow means Warning, and green is the Normal state.
Avg Packet Loss. The average percentage of time the data packets sent to the monitored device are not echoed back. By default, the monitoring agent sends five data packets to the monitored network device. The number of data packets the Net Monitor Agent sends to monitored devices is specified in the Net Monitor Agent properties.
Avg Response Time. The average round-trip response time between the monitoring agent and the network device.
Executions. The number of times the Net Monitor Agent sends data packets to the selected network device.
Monitoring Location. The name of the host from which the selected network device is monitored.

Drill down on:

Trace Route Now. For more information, see Trace Result view.

Shows how well the selected network device is responding to the data collection requests from all of the monitoring locations.

Outage. A color-coded bar, representing the availability of the monitored network device over the selected time range. The color of the bar reflects the percentage of time the device is unresponsive.
Packet Loss. The percentage of time the data packets sent to the monitored device are not echoed back, over the selected time range. By default, the monitoring agent sends five data packets to the monitored network device. The number of data packets the Net Monitor Agent sends to monitored devices is specified in the Net Monitor Agent properties.
Response Time. The round-trip response time between the monitoring agent and the network device, over the selected time range.

FAQ tab

The FAQ tab shows answers to common questions related to your network devices or monitoring locations.

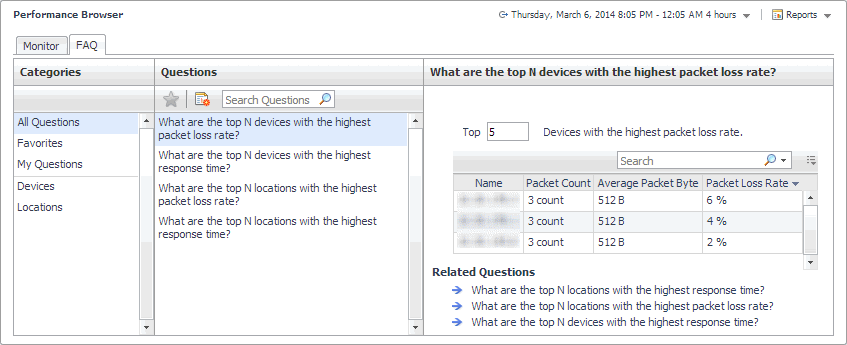
Navigate to the Performance Browser, and open the FAQts tab.

This view is made up of the following embedded views:

This view provides an answer to the question selected in the Questions view. The answer appears in the following form:

Top x <objects of category>…

Where x is the number of objects of the category you provided in the Categories view.

Specify x by entering a number.

This view lists the categories for which questions can be answered for you by Foglight.

Click a category in the list to select it.

This view lists the questions, for the category selected in the Categories, that can be answered for you by Foglight.

Click a question in the list to select it.

If the list of questions is long and you want to narrow it down, search for a particular text string using the Search Questions box.

FAQts view

The FAQts view shows answers to common questions related to your transactions or locations. The collection of available questions depends on the tile selected in the Net Monitor Environment view. If you select the Network Devices tile, this view displays the questions related to the monitored network devices. Selecting the Monitor Locations tile causes the view to display the questions related to your monitoring locations.

In the Performance Browser, in the Quick View, the FAQts view appears in the bottom-left corner.

관련 문서

The document was helpful.

평가 결과 선택

I easily found the information I needed.

평가 결과 선택