지금 지원 담당자와 채팅
지원 담당자와 채팅

Foglight for Infrastructure 5.9.5 - Infrastructure Utilities User Guide

Monitoring Web transactions Monitoring network devices

Configuring the Agent Manager ICMP service

Configuring OS-Level ICMP services

Ensure that the ping and tracert commands are available.
Ensure that the ping and traceroute commands are available.
For Suse Linux with the apparmor module, enable traceroute to execute with the -I option. For example:

Managing monitored network devices

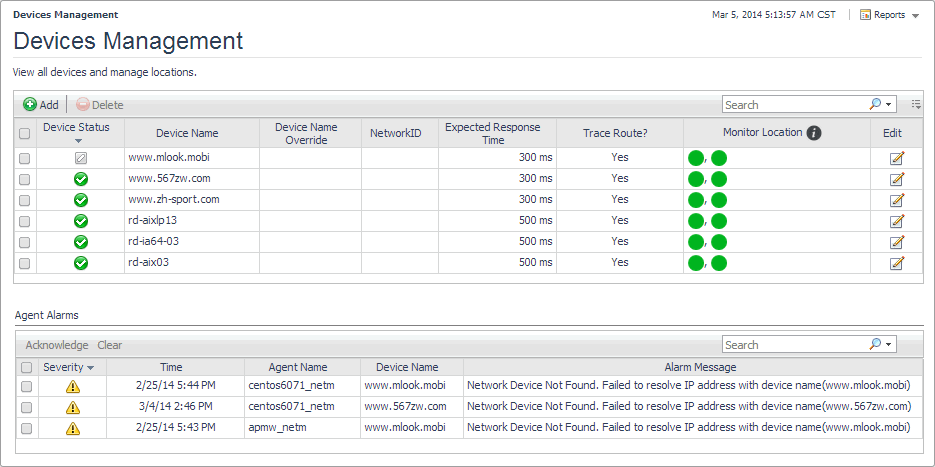
The Devices Management dashboard displays a list of the monitored network devices. It allows you to add or remove network devices from the collection, and to edit their data collection parameters.

You can add one or more network devices using the Devices Management dashboard, and select desired agents (monitoring locations). Use this dashboard to gain an understanding of the complexity of your monitored environment and to review any alarms associated with the monitored devices.

For complete details about the views appearing on this dashboard, see Net Monitor Devices Management views.

2
On the navigation panel, under Dashboards, click Infrastructure > NetMonitor > Devices Management.

For more information, see the following topics:

Expanding your collection of monitored network devices

The Devices Management dashboard allows you to expand your collection of monitored network devices by adding new devices to the list. Adding a new network device prompts the Net Monitor Agent to start collecting information about it in the next collection period.

This assumes that you already have the agent package deployed to the Foglight Agent Manager host, and one or more active Net Monitor Agent instances are in place. For complete information on how to deploy an agent package, and how to create and activate agent instances, see the Administration and Configuration Help.

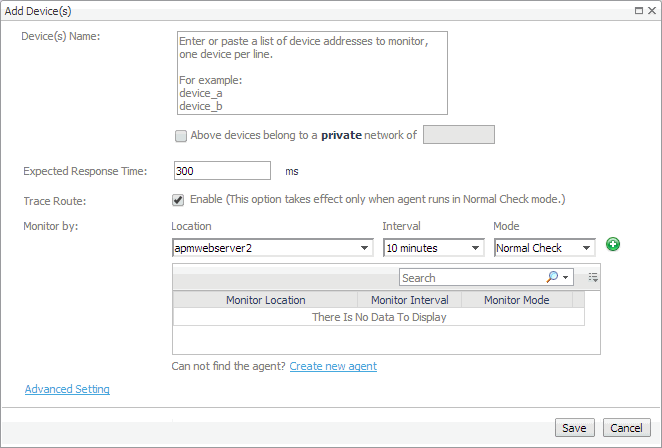
The Add Device(s) dialog box appears.
2
In the Add Device(s) dialog box, provide information about the network device that you want to monitor.
Device(s) Name: Type the names of one or more network devices that you want to monitor. This can be a host name or a host IP address. If a host name is specified, Foglight Net Monitor resolves it using DNS.
Above devices belong to a private network of: If the hosts on which these devices are installed belong to a private network, select this check box and type the network name.
Expected Response Time. Specify the expected amount of round-trip response time in milliseconds between the monitored location and the network device.
Trace Route (Enable): Select this check box if you want to trace the route from the monitoring station to the device. If you do not select this option, you can execute a trace route in real time on the Trace Route page. For more information, see Tracing data packets between monitoring locations and network devices.
Monitor by: Specify one or more rules for collecting information about the monitored devices.
Location: Select the host from which you want to collect information about the monitored devices.
To add a new monitoring host, you must first create a Net Monitor Agent instance on that host, activate it, and start its data collection. To do that, click Create new agent. For more information about creating and activating agent instances and starting their data collection, see the Administration and Configuration Help.
Interval: Specify the collection interval for this device. The values in the list reflect the data collection intervals that are configured for all Net Monitor Agent instances that are running on the selected location. For example, if there are two agents with collection intervals of 10 and 15 minutes, these intervals appear in the list.
Mode: Specify the collection mode that you want to use for this device. The values in the list reflect the collection modes that are configured for all Net Monitor Agent instances that are running on the selected location. For example, if there are two agents with one running in Quick Check mode, and another in Normal mode, both collection modes appear in the list.
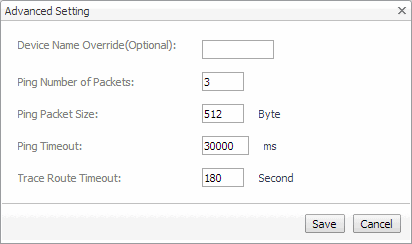
Advanced Settings: To specify advanced settings such as the device name override, the number of packets to ping, the packet size when pinging, ping timeout, or trace route timeout, click Advanced Settings and override the default values, as required.
Device Name Override (Optional): Type the device name override, as required. Device name override can be used if you monitor two network devices that share an IP address. You can override the name of one of those devices to identify it. If specified, the device override name appears as that device's name in the browser interface. Another reason why you might need to override a device name is when a device is a host object in the Management Server. In that case, if you do not override the device name, its status reflects the host object status, instead of the device status.
Ping Number of Packets: Type the number of ICMP (Internet Control Message Protocol) or UDP (Universal Datagram Protocol) packets to send to the device.
Ping Packet Size: Type the size of the data portion of the packet in bytes.
Trace Route Timeout: Type the amount of time in seconds after which a route trace times out.
When done, click Save in the Advanced Settings dialog box.
3
In the Add Device(s) dialog box, click Save.
The Add Device(s) dialog box closes, and the Devices Management dashboard refreshes, showing the newly added device in the list.
관련 문서

The document was helpful.

평가 결과 선택

I easily found the information I needed.

평가 결과 선택