지금 지원 담당자와 채팅
지원 담당자와 채팅

Foglight for Infrastructure 5.9.2 - User Guide

Using Foglight for Infrastructure Monitoring log files with Foglight Log Monitor Monitoring IBM PowerVM environments
Before you begin Managing PowerVM HMC agents Monitoring your PowerVM environment
Advanced system configuration and troubleshooting Reference
Advanced System Configuration Foglight for Infrastructure views Foglight Log Monitor views Rules Metrics
Appendix: Building regular expressions in Foglight

Drilling down on physical and virtual network adapters

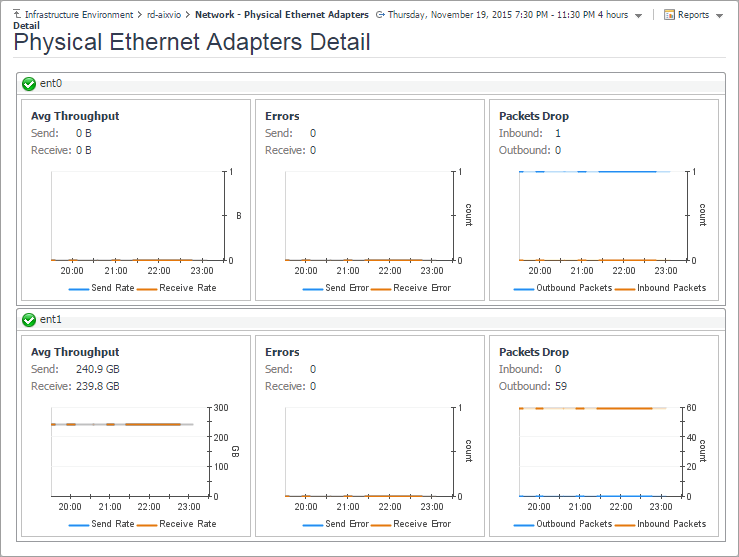
The Network - Virtual Ethernet Adapters Detail and Network - Physical Ethernet Adapters Detail views provide information about physical and virtual network adapters associated with the selected PowerVM® VIOS. Use it to find out if the adapters exhibits low throughput, high levels of dropped packets or errors, to maintain the stability of your system and ensure optimum network throughput levels.

To navigate to these views, in the Selected Service PowerVM view, select a PowerVM VIOS, and click Explore. Open the Network tab, and then open the Summary tab. In the Virtual Ethernet Adapters Summary area, click View VEA Details, to see the Network - Virtual Ethernet Adapters Detail view. To access the Network - Physical Ethernet Adapters Detail view, in the Physical Ethernet Adapters Summary area, click View PEA Details.

Send

The current rate at which virtual network adapters encounter errors while sending data to the network.

Receive

The current rate at which virtual network adapters encounter errors while receiving data from the network.

Send Rate

The average rate at which virtual network adapters encounter errors while sending data to the network during the selected time range.

Receive Rate

The average rate at which virtual network adapters encounter errors while receiving data from the network during the selected time range.

Send

The current rate at which virtual network adapters encounter errors while sending data to the network.

Receive

The current rate at which virtual network adapters encounter errors while receiving data from the network.

Send Error

The average rate at which virtual network adapters encounter errors while sending data to the network during the selected time range.

Receive Error

The average rate at which virtual network adapters encounter errors while receiving data from the network during the selected time range.

Inbound

The current rate at which virtual network adapters drop data packets while sending data to the network. By default, network adapters send or receive multiple data packets in a single request. When data packets are dropped before reaching their destinations, this may indicate a problem with the network connection or the network adapters.

Outbound

The current rate at which virtual network adapters drop data packets while receiving data from the network.

Inbound Packets

The average rate at which virtual network adapters drop data packets while sending data to the network during the selected time range.

Outbound Packets

The average rate at which virtual network adapters drop data packets while receiving data from the network during the selected time range.

Investigating object dependencies

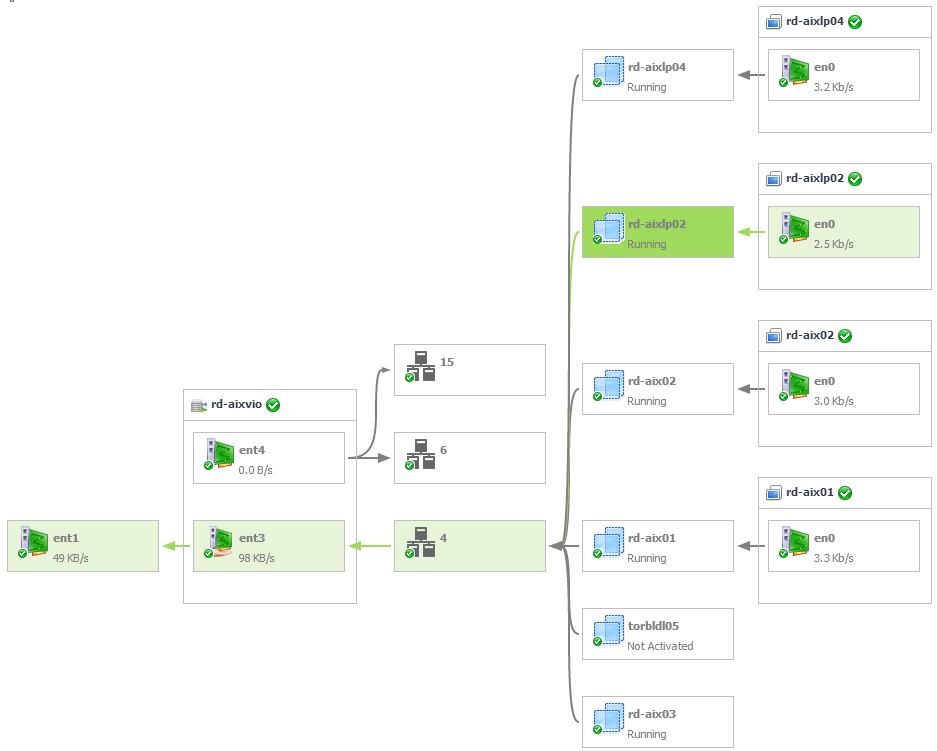
Dependency views visualize the relationships between the selected memory, disk, and network elements and other objects in your integrated environment, through an interactive map. Use these view to better understand resource-related dependencies, to predict the impact a potential outage may have on your environment, and to prevent such events, by reallocating resources where they are most needed.

To navigate to dependency views, in the Selected Service PowerVM view, select a PowerVM® partition, managed server, or PowerVM VIOS, and click Explore. Open the Memory tab (managed servers only), Storage tab, or Network tab, and then open the Dependencies tab.

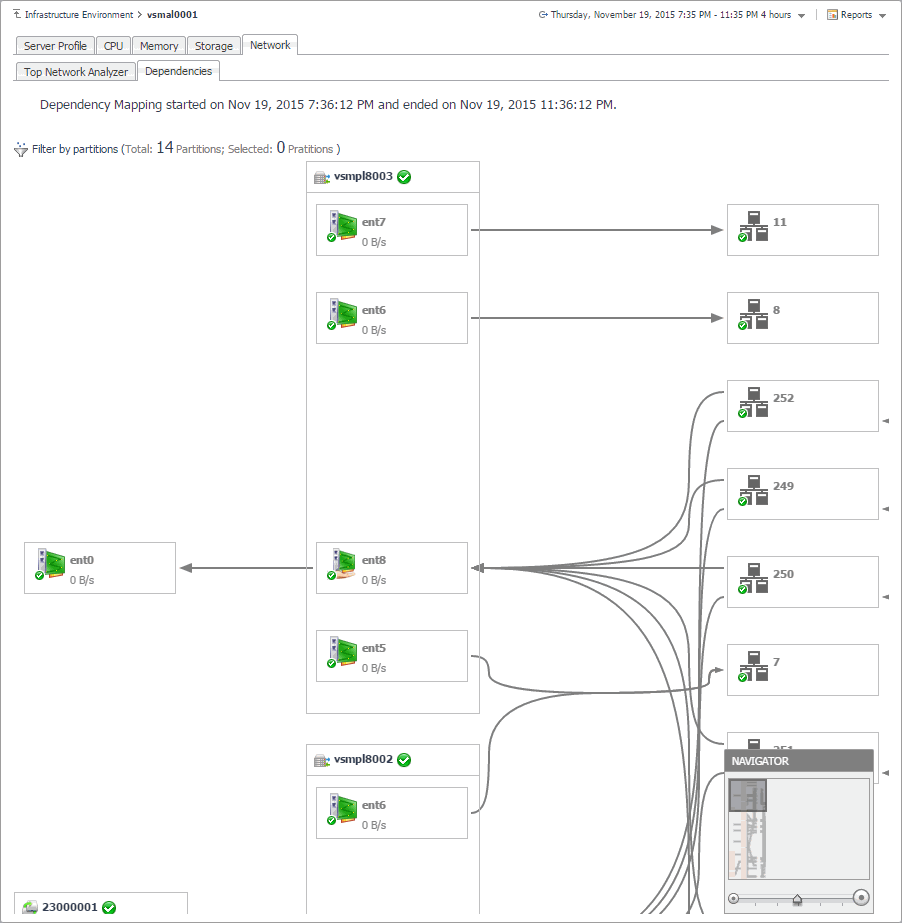
Figure 37. Dependency tab

A typical PowerVM environment consists of many interrelated components. Understanding the dependencies between logical and virtual components in your monitored environment and the levels of resources they consume allows you to project possible performance bottlenecks that can affect the stability of your system. This can help you predict the impact a potential outage may have on your environment, and to prevent such events, by reallocating resources where they are most needed.

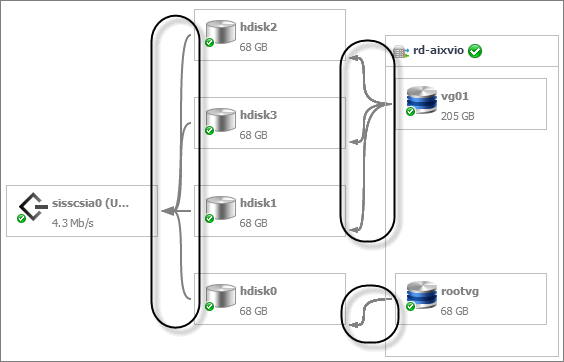
The Dependencies dashboard visualizes the relationships between the objects in your environment through an interactive map. The map illustrates how different components relate to each other, and the levels of the available resources available to them.

1
On the Infrastructure Environment dashboard, on the Monitoring tab, select a managed server, partition, or VIOS, and click Explore.
2
On the Detail view appearing in the display area, open the Storage or Network tab, and click Dependency.
Figure 39. Dependency map

The complexity of the information appearing in a dependency map depends on the selected object and the dependencies that object has with other objects within your integrated infrastructure.

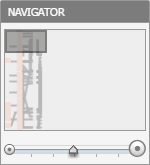
In a large multi-component environment, dependency maps are likely complex and may not fit your screen. The NAVIGATOR in the top-right corner allows you to easily set the zoom level by dragging the slider into a desired position.

Figure 40. NAVIGATOR

In a dependency map, some objects are represented with container tiles, others with single-object tiles or just icons. Every object is represented with an icon, representing its type. This allows you to quickly identify the elements of a dependency map.

Partition

VIOS

Host

Host’s disk

Disk pool

Physical disk

Network adapter

SCSI adapter

VLAN


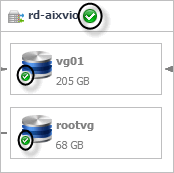
Every object appearing in the map includes an indicator of its health.

Figure 41. Health indicator

Dependencies between the objects in a map are illustrated with single-directional arrows.

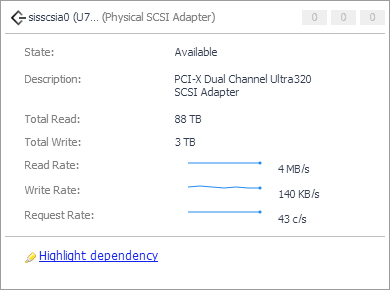
To find out more about an object appearing in the dependency map, click the object icon. A dwell appears, displaying more details about that object. The type and range of information appearing in the dialog box depends on the selected object’s type. For example, drilling down on a SCSI Adapter shows the counts of alarms generated against the selected adapter in each severity state, the adapter's state and description, and displays information about the data traffic processed by the adapter.

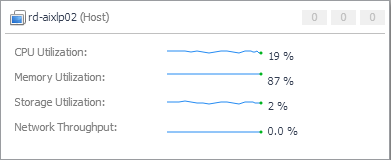
However, if you drill down on a host object the resulting dialog box displays the counts of alarms generated against the selected host in each severity state, and the levels of processor, memory, network, and datastore resources the currently host uses.

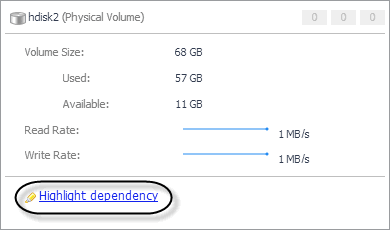
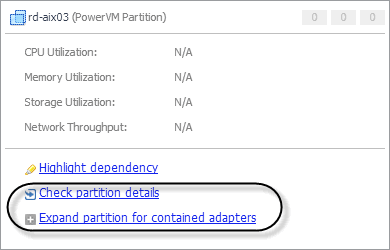
Certain object types allows you to trace down the dependencies an object has with multiple map elements. Use this feature if you want to find out which elements are associated with a particular object whose performance you want to investigate. To do that, click the object on the map, and in the dwell that appears, click Highlight dependency.

This causes all of the related objects and dependencies to appear highlighted in the map.

In addition to Highlight dependency, some object types offer other options when selected. For example, when you click a partition, you can click Check partition details to drill down on the partition, or Expand partition or Collapse partition for contained adapters to show or hide the network adapters the selected partition uses.

Figure 47. Check partition details and Expand partition links

When you drill down on a managed server or a VIOS, their dependency maps allow you to filter the map by a partition. Doing so allows you to display only those elements associated with one or more desired partitions. This can help you to isolate specific objects in your integrated environment, and to quickly focus your attention on possible bottlenecks.

Reviewing frequently asked questions

Foglight for PowerVM™ offers a collection of frequently asked questions that provide quick insight into resource utilization levels for the applications, desktops, user sessions, and the overall infrastructure in your monitored system. The question mechanism is interactive, guiding you to choose a category and specify additional parameters.

You can find the available questions on the FAQts tab of the Infrastructure Environment dashboard.

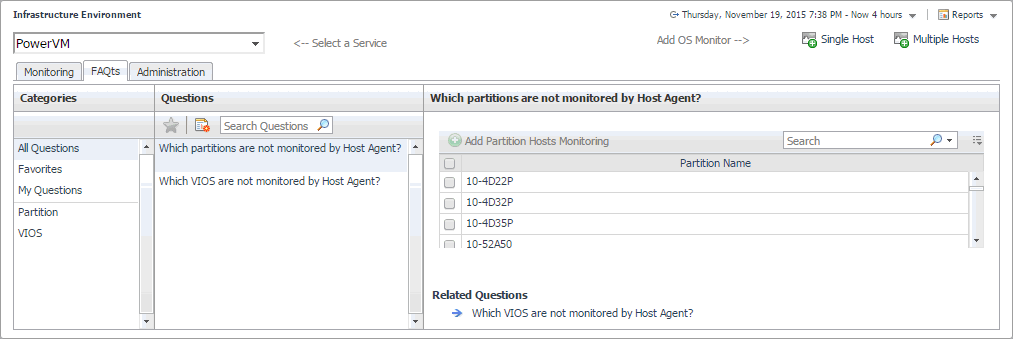
Figure 49. FAQts tab

On this tab, the Categories pane contains several question groups. Selecting a category shows the questions belonging to that category in the Questions pane. From there, clicking a question shows the answer on the right.

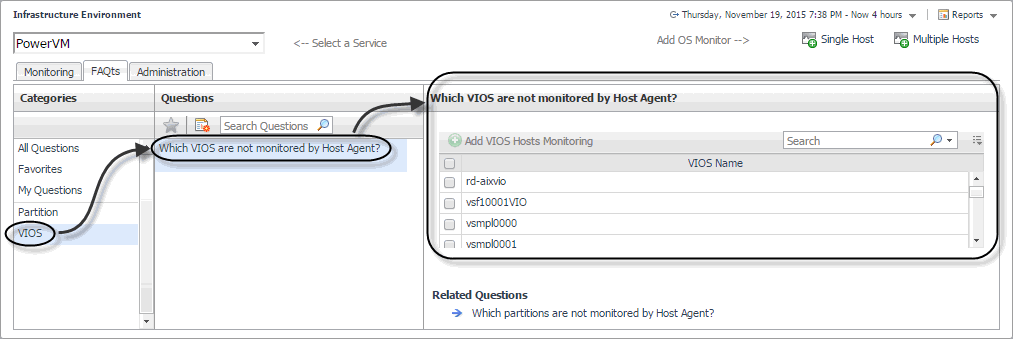
Figure 50. Finding answers

Monitoring a partition or VIOS with Foglight for Infrastructure

If you want to monitor a VIOS or a partition with Foglight for Infrastructure, you can quickly create a Host agent. Foglight for PowerVM allows you to monitor the health of the system infrastructure associated with a monitored VIOS or a partition. For complete information about host agents, see Using Foglight for Infrastructure agents.

a
On the FAQts tab, in the Categories pane, select VIOS or All Questions.
b
In the Questions pane, select Which VIOS are not monitored by Host Agent.
c
In the Which VIOS are not monitored by Host Agent pane, select a VIOS, and click Add VIOS Hosts Monitoring.
a
On the FAQts tab, in the Categories pane, select Partition or All Questions.
b
In the Questions pane, select Which partitions are not monitored by Host Agent.
c
In the Which partitions are not monitored by Host Agent pane, select a partition, and click Add Partition Hosts Monitoring.
The Add LPAR Host - List wizard appears.
3
In the Add LPAR Host - List wizard, on the Agent Manager page, select the Agent Manager that you want to associate with the Host agent you are about to create.
a
Click Agent Manager and select the Agent Manager host that you want to use to associate with the Host agent. The list includes only the Foglight Agent Managers to which the Foglight for Infrastructure agent package is already deployed.
b
Ensure that the Virtual / Guest check box is cleared.
c
Click Next.
The Add LPAR Host - List wizard refreshes, showing the Host List page.
4
In the Add LPAR Host - List wizard, on the Host List page, review the list of VIOS or partition instances that you selected for monitoring.
b
Click Next.
5
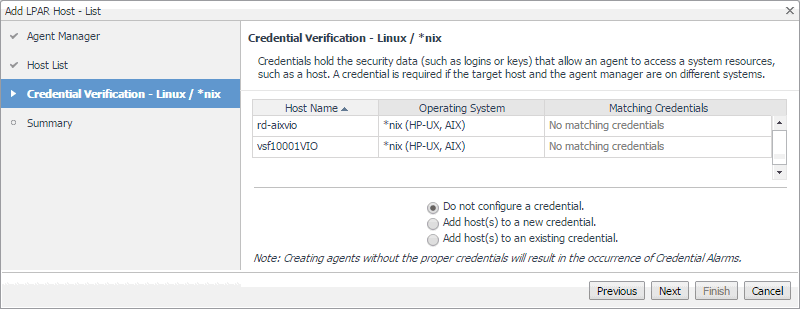
On the Credentials Verification page, select one of the following options:
Do not configure a credential: Select this option if you want to configure the credential for this component at a later time. Click Next and continue to Step 8.
Add host(s) to a new credential: Select this option if you want to create a new credential for this component. This option is suitable if none of the existing credentials have the connection details needed to access the new host. Click Next and continue to Step 6.
Add host(s) to an existing credential: Select this option if you want the Host agent to use an existing credential to access this component. This option is suitable if an existing credential has the security data needed to access this component (such as user name and password), but you need to edit its resource mappings to include this component. Click Next and continue to Step 7.
a
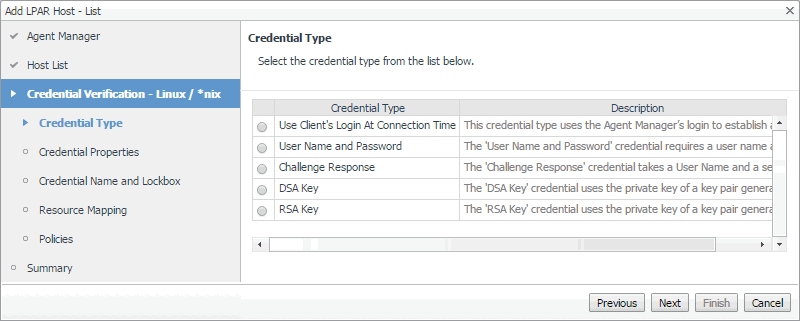
On the Credential Type page that appears, select the desired credential type.
b
On the Credential Type page, click Next.
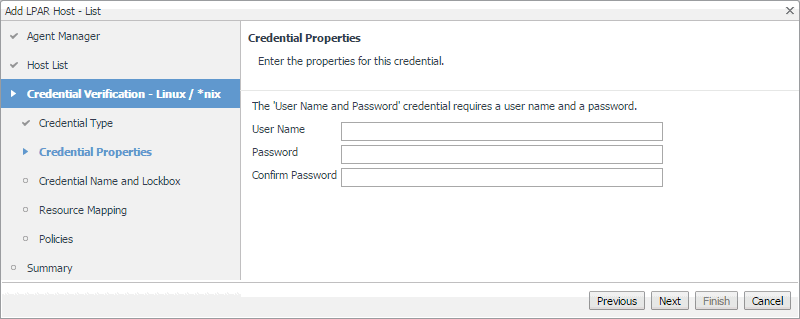
The Credential Properties page appears.
c
On the Credential Properties page, provide the required information. The level of required data depends on the selected credential type. For example, a User Name and Password credential needs a user name and a password, while a Challenge Response credential requires a user name along with a question/response pair.
d
On the Credential Properties page, click Next.
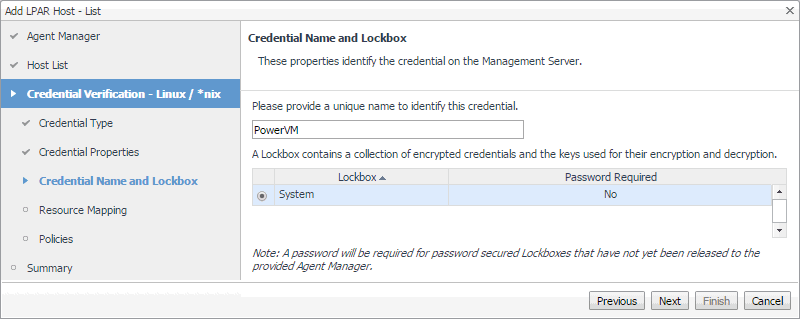
The Credential Name and Lockbox page appears.
e
On the Credential Name and Lockbox page, provide a name to identify the credential, and select a lockbox in which you want to keep the credential. A lockbox can be used to group credentials for access and/or security. The default System lockbox is sufficient for smaller installations.
f
On the Credential Name and Lockbox page, click Next.
The Resource Mapping page appears.
g
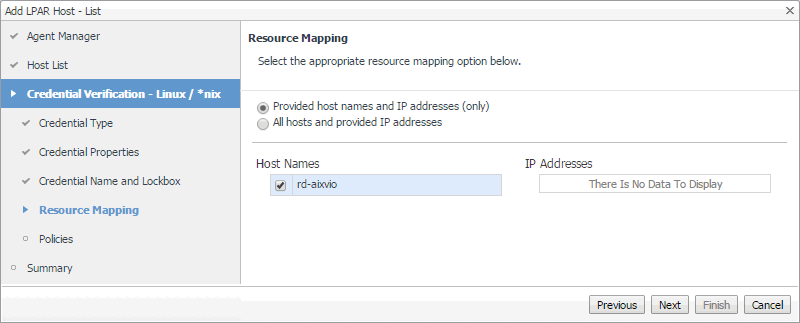
On the Resource Mapping page, ensure that the VIOS or partition components that you want to associate with this credential are selected.
h
On the Resource Mapping page, click Next.
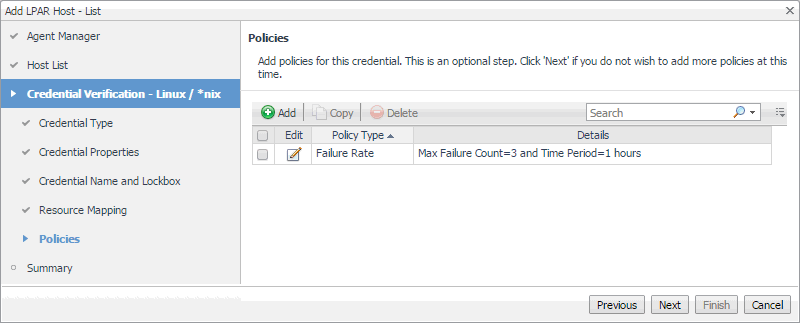
The Policies page appears.
i
Optional—On the Policies page, define one or more policies for this credential. A policy defines the number of times a credential can be used, the number of allowed authentication failures, the time range during which the credential is valid, or the length of time the credential data can be cached on the client. For example, you can specify the number of times the credential can be used, or the time period during which it can be used. For complete information about the available credential policies, see the Administration and Configuration Help.
j
On the Policies page, click Next. Continue to Step 8.
a
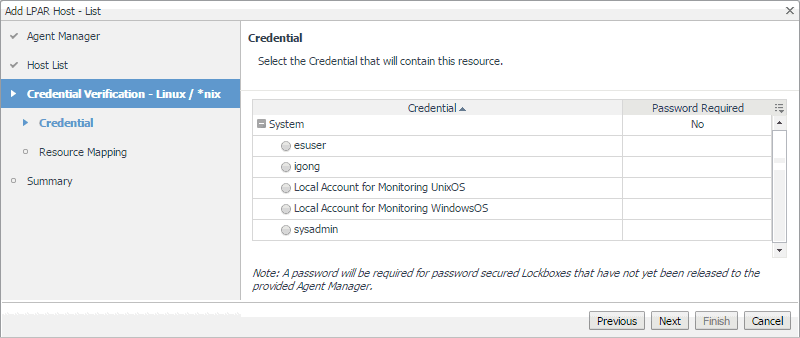
On the Credential page that appears, select an existing credential that you want the Host agent to use to access this component.
b
On the Credential page, click Next.
The Resource Mapping page appears.
c
On the Resource Mapping page, ensure that the VIOS or partition components that you want to associate with this credential are selected.
d
On the Resource Mapping page, click Next. Continue to Step 8.
8
On the Summary page that appears, review the information about the monitored component, selected Agent Manager, and the credential.
9
Click Finish.
After a few moments, a new host appears on the Hosts dashboard and a new instance of the monitoring Host agent is created. The Agent Creation Successful dialog box appears. Review the information in this dialog box.


관련 문서

The document was helpful.

평가 결과 선택

I easily found the information I needed.

평가 결과 선택