지금 지원 담당자와 채팅
지원 담당자와 채팅

Foglight for Infrastructure 5.9.2 - User Guide

Using Foglight for Infrastructure Monitoring log files with Foglight Log Monitor Monitoring IBM PowerVM environments
Before you begin Managing PowerVM HMC agents Monitoring your PowerVM environment
Advanced system configuration and troubleshooting Reference
Advanced System Configuration Foglight for Infrastructure views Foglight Log Monitor views Rules Metrics
Appendix: Building regular expressions in Foglight

Investigating volume-based storage pools

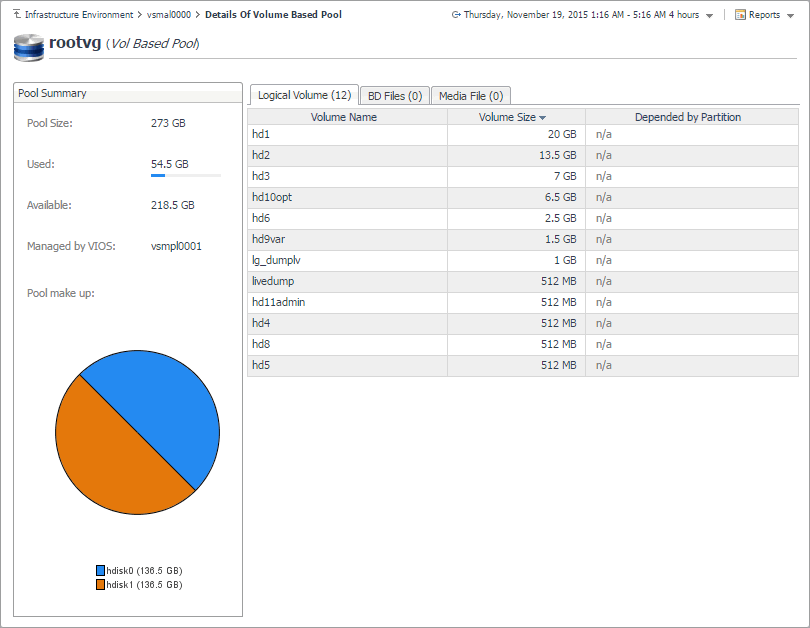
PowerVM® managed servers and PowerVM virtual I/O servers typically rely on volume-based shared storage pools to efficiently use system resources and increase their overall utilization. When you explore the managed server and PowerVM VIOS Storage Breakdown views, you can drill down on a volume-based storage pool to see the logical volumes that belong to it, the PowerVM partition associated with them, their size, and other details, in the Details Of Volume Based Pool view. This view also displays general information about the selected disk pool, such as its size, the managing VIOS, and identifies the hard disks on which the containing logical disk partitions. Use this view to find out the sizes of individual volumes and their association with PowerVM partitions, when needed.

To navigate to this view, in the Selected Service PowerVM view, select a managed server or a PowerVM VIOS, and click Explore. Open the Storage tab, and in the Volume Based Pool Entitled view, click the title bar of the volume-based pool that you want to investigate.

Use this view to find out how the selected object uses the allocated resources, and if there are any patterns indicating their usage levels that may potentially compromise the stability of your infrastructure.


Pool Size

The total amount of disk space participating in the volume-based pool.


Used

The total of disk space participating in the volume-based pool that is currently in use.


Available

The total of disk space participating in the volume-based pool that is currently available.


Managed by VIOS

The PowerVM VIOS that is managing the volume-based pool.


Pool make up

A pie chart indicating the amount of disk space each physical disk contributes to the volume-based pool.


Volume Name

The name of the logical disk.


Volume Size

The size of the logical disk.


Depended by Partition

The name of the PowerVM partition using the logical disk.


BD File

The name of the Backing Device (BD) file, used for storage virtualization.


File Size

The size of the BD file.


Depended by Partition

The name of the PowerVM partition using the BD file.


Media File

The name of the file created by the media repository, used for optical virtualization.


File Size

The size of the media file.


Depended by Partition

The name of the PowerVM partition using the media file.

Exploring top resource analyzers

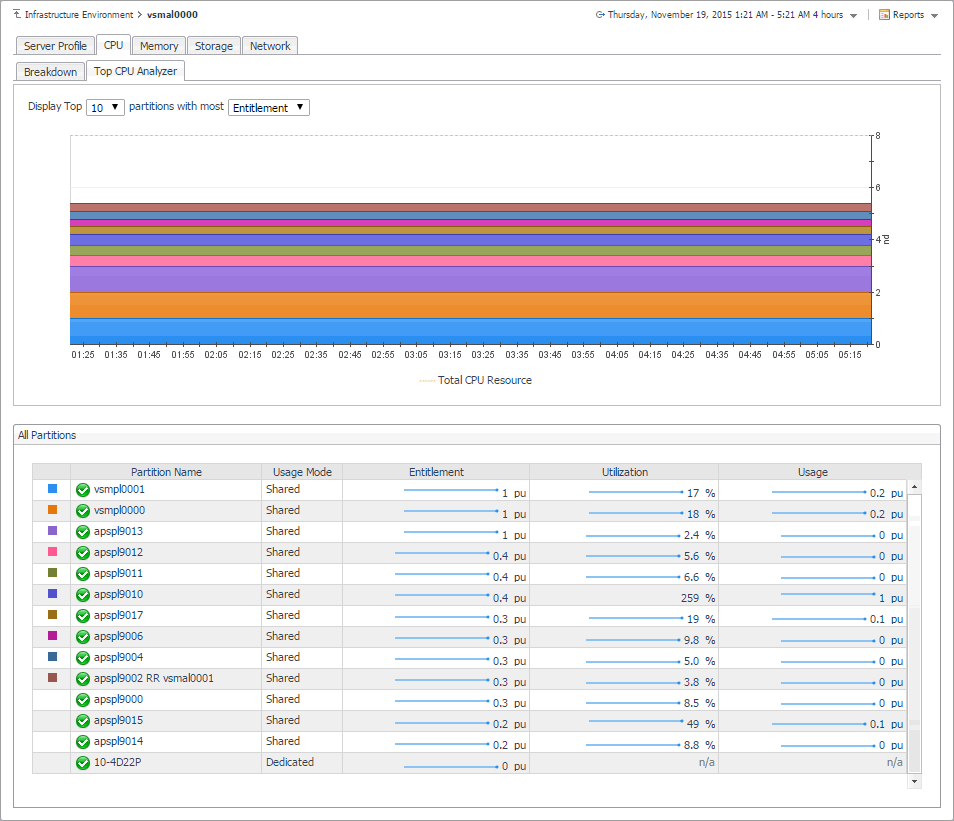
The Top Analyzer views appearing on the individual tabs of the managed server details view and PowerVM VIOS details view identify the partitions with the highest resource entitlement, utilization, and usage, and the physical adapters with the highest network throughput. Use them it to find out if any of the logical partitions running on the selected managed server or associated with the selected PowerVM VIOS show the signs of processor, memory, or disk space exhaustion or poor utilization, or unusually high network activity. This can help you maintain the stability of your system and ensure optimum resource usage.

To navigate to this tab, in the Selected Service PowerVM view, select a managed server or a VIOS, and click Explore. Open the CPU (managed servers only), Memory (managed servers only), Storage, or Network tab, and open the Top CPU Analyzer (managed servers only), Top Memory Analyzer (managed servers only), Top Storage Analyzer, or Top Network Analyzer tab.

Display Top n partitions with most…

Select the number of partitions that you want to display and the metric type that you want to use as a filter.

When Entitlement is selected, the Total CPU Resource areas in the graph represent the number of processing units allocated to the PowerVM partitions that are associated with the managed server.

When Utilization is selected, the areas in the graph represent the percentage of the managed server processor resources allocated to the partitions that are associated with the server and in use over the selected time range.

When Usage is selected, the areas in the graph represent the number of processing units allocated to the partitions associated with the managed server that are in use over the selected time range.

When Entitlement is selected, the Total Memory Resource areas in the graph represent the amount of memory resources allocated to the PowerVM partitions that are associated with the managed server.

When Utilization is selected, the areas in the graph represent the percentage of the managed server memory resources allocated to the partitions associated with the server that are in use over the selected time range.

When Usage is selected, the areas in the graph represent the amount of memory resources allocated to the partitions associated with the managed server that are in use over the selected time range.

When Usage is selected, the areas in the graph represent the disk space allocated to the partitions associated with the managed server or PowerVM VIOS, that are in use over the selected time range.

The name of the partition.

Top CPU Analyzer and Top Memory Analyzer only. Indicates if the processor or memory resources allocated to the PowerVM partition are participated in shared processor or memory pools (Shared), or are dedicated specifically to that partition (Dedicated).

A spark line indicating the amount of processor, memory, or storage resources that are allocated to the PowerVM partition.

A spark line indicating the percentage of processor or memory resources allocated to the partition that are in use.

A spark line indicating the amount of processor, memory, or storage resources that are currently in use by the PowerVM partition.

The areas in the chart represent the rate at which each identified physical adapter transfers data to and from the network.

The name of the physical adapter.

A sparkline indicating the rate at which the physical adapter transfers data to and from the network.

A sparkline indicating the rate at which the physical adapter drops data packets while transferring data to and from the network. By default, network adapters send or receive multiple data packets in a single request. When data packets are dropped before reaching their destinations, this may indicate a problem with the network connection or the network adapters.

A sparkline indicating the rate at which the physical adapter encounters errors while transferring data to and from the network.

Exploring PowerVM VIOS network summaries

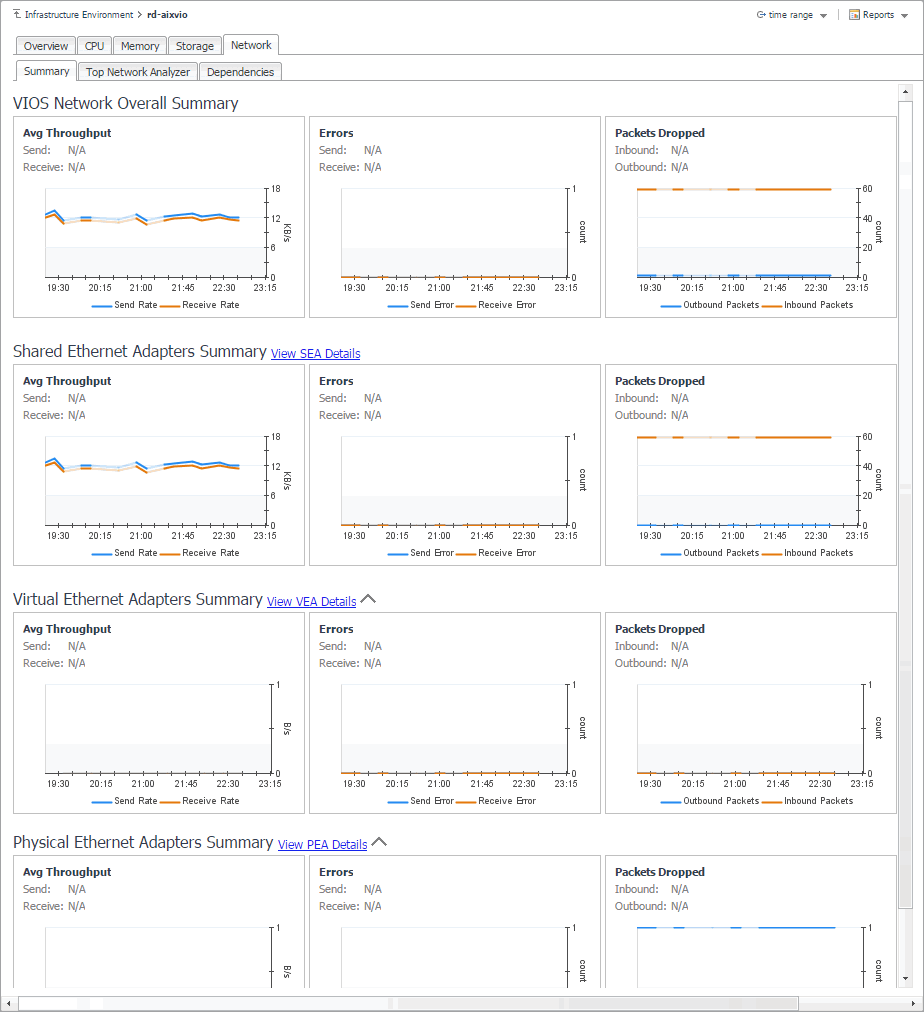
The Summary tab on the Network tab of the PowerVM VIOS detail view provides information all network adapters associated with the selected PowerVM® VIOS, shared ethernet adapters, virtual ethernet adapters, and physical ethernet adapters. Use it to find out if any specific collection of adapters exhibits low throughput, high levels of dropped packets or errors, to maintain the stability of your system and ensure optimum network throughput levels.

To navigate to this tab, in the Selected Service PowerVM view, select a PowerVM VIOS, and click Explore. Open the Network tab, and open the Summary tab.

Figure 34. Summary tab

Table 16. Summary view

Displays information about all network adapters associated with the selected PowerVM VIOS.

Displays information about shared network adapters associated with the selected PowerVM VIOS.

Displays information about virtual network adapters associated with the selected PowerVM VIOS.

Displays information about physical network adapters associated with the selected PowerVM VIOS.

Send

The current rate at which monitored network adapters send data to the network.

Receive

The current rate at which monitored network adapters receive data from the network.

Send Rate

The average rate at which monitored network adapters send data to the network during the selected time range.

Receive Rate

The average rate at which monitored network adapters receive data from the network during the selected time range.

Send

The current rate at which monitored network adapters encounter errors while sending data to the network.

Receive

The current rate at which monitored network adapters encounter errors while receiving data from the network.

Send Error

The average rate at which monitored network adapters encounter errors while sending data to the network during the selected time range.

Receive Error

The average rate at which monitored network adapters encounter errors while receiving data from the network during the selected time range.

Inbound

The current rate at which monitored network adapters drop data packets while sending data to the network. By default, network adapters send or receive multiple data packets in a single request. When data packets are dropped before reaching their destinations, this may indicate a problem with the network connection or the network adapters.

Outbound

The current rate at which monitored network adapters drop data packets while receiving data from the network.

Inbound Packets

The average rate at which monitored network adapters drop data packets while sending data to the network during the selected time range.

Outbound Packets

The average rate at which monitored network adapters drop data packets while receiving data from the network during the selected time range.

Drilling down on shared network adapters

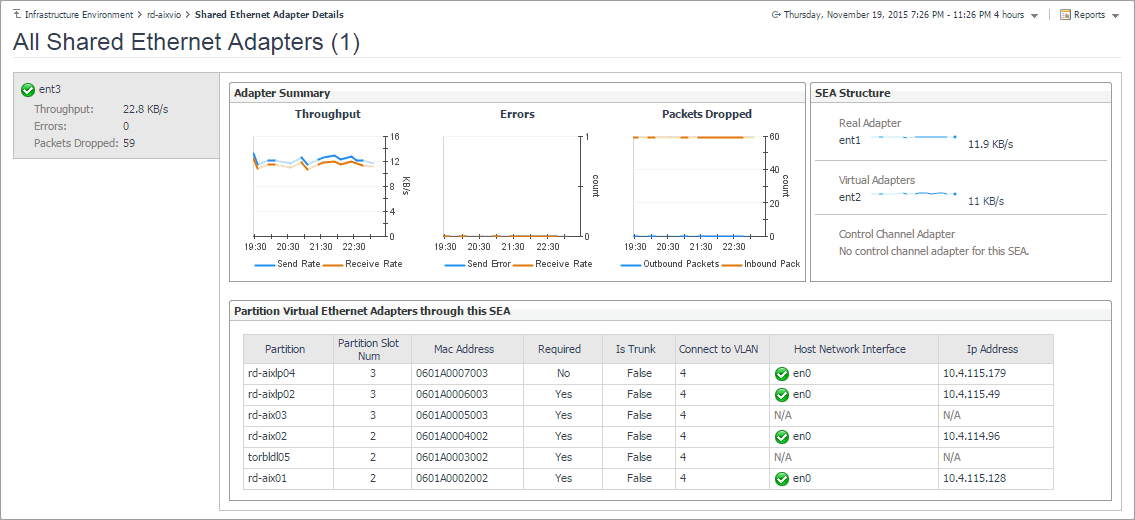
The Shared Ethernet Adapter Details view provides information about all shared network adapters associated with the selected PowerVM® VIOS. A shared network adapter enables multiple PowerVM partitions to share one adapter, to optimize the overall use of physical resources. Use it to find out if the adapters exhibits low throughput, high levels of dropped packets or errors, to maintain the stability of your system and ensure optimum network throughput levels. You can also use this view to review the PowerVM partitions that use these adapters, and to review their settings.

To navigate to this view, in the Selected Service PowerVM, select a PowerVM VIOS, and click Explore. Open the Network tab, click Summary, and in the Shared Ethernet Adapters Summary area, click View SEA Details.

Send

The average rate at which shared network adapters send data to the network during the selected time range.

Receive

The average rate at which shared network adapters receive data from the network during the selected time range.


Send Error

The average rate at which shared network encounter errors while sending data to the network during the selected time range.

Receive Error

The average rate at which shared network adapters encounter errors while receiving data from the network during the selected time range.

Inbound Packets

The average rate at which shared network adapters drop data packets while sending data to the network during the selected time range. By default, network adapters send or receive multiple data packets in a single request. When data packets are dropped before reaching their destinations, this may indicate a problem with the network connection or the network adapters.

Outbound Packets

The average rate at which shared network adapters drop data packets while receiving data from the network during the selected time range.


Real Adapter

Virtual Adapter

Channel Control Adapter

A sparkline indicating the rate at which physical, virtual, Ether Channel, or control channel network adapters send and receive data from the network


Partition

The PowerVM partition using this network adapter.


Partition Slot Num

The slot number associated with the PowerVM partition.


Mac Address

The MAC address of the PowerVM partition.


Required

Indicates whether the I/O slot or virtual I/O adapter is required for the partition. Valid values:

0: Required
1: Not required


Is Trunk

Indicates whether the virtual Ethernet adapter is the trunk or uplink adapter for the virtual LAN. Valid values:

0: Yes
1: No


Connect to VLAN

The virtual LAN ID.


Host Network Interface

The physical network adapter associated with the PowerVM partition.


Ip Address

The IP address of the PowerVM partition.

관련 문서

The document was helpful.

평가 결과 선택

I easily found the information I needed.

평가 결과 선택