지금 지원 담당자와 채팅
지원 담당자와 채팅

Foglight for Hyper-V 7.1.0 - User Guide

About Hyper-V Monitoring in Foglight Evolve Cloud Agent administration Performance monitoring with the Hyper-V Environment dashboard Performance investigation with the Hyper-V Explorer Hyper-V Monitoring in Foglight Evolve Cloud alarms Appendix: Hyper-V Agent error codes

Hyper-V Explorer Storage tab (clusters)

The Hyper-V Explorer Storage tab displays combination of embedded views displaying disk volumes associated with the selected cluster. It identifies the virtual machines that spend the highest amounts of disk resources. Use this tab to find out more about the overall consumption of disk resources for a given cluster. The information provided on this tab can help you prevent potential bottlenecks by reallocating disk resources where they are most needed.

This tab appears in the Hyper-V Explorer when you select a cluster on the Hyper-V Explorer Topology tab.
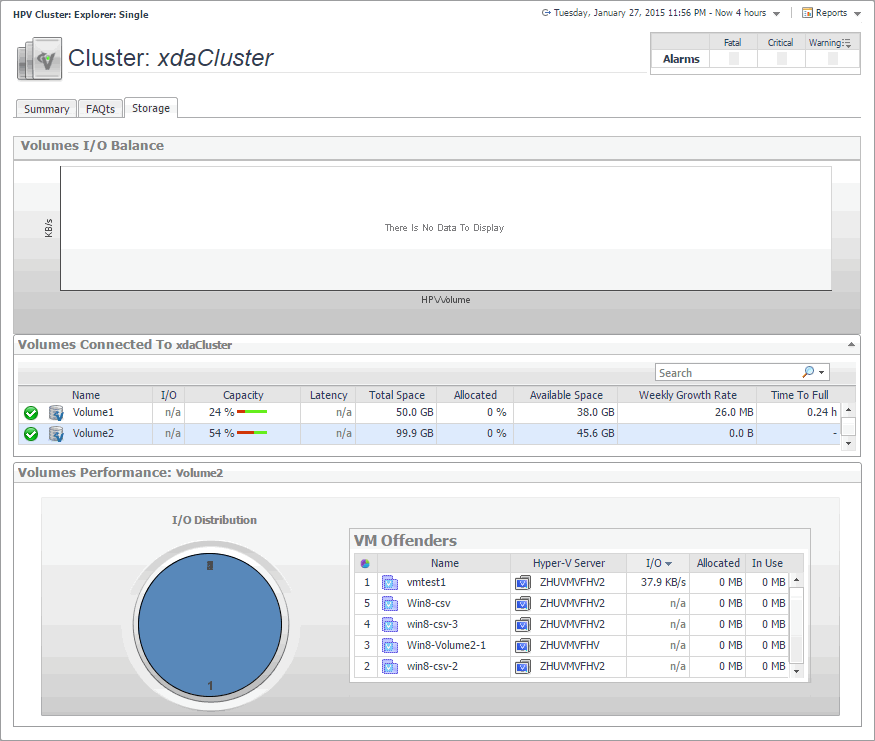
Figure 46. Storage tab (clusters)

This tab is made up of the following embedded views:

Shows the data transfer rates for each disk volume connected to the selected cluster.

Table 16. Volumes Connected To Cluster

Lists the disk volumes connected to the selected cluster and shows performance metrics associated with each volume.

Allocated. The amount of space allocated to the selected cluster.
Available Space. The amount of space available on the disk volume.
Capacity. The percentage of the disk space that is currently in use.
I/O. The disk volume's current data transfer rate.
Latency. The current latency of the disk volume.
Name. The name of the disk volume. The indicator on the left shows the disk volume’s alarm state: Normal, Warning, Critical, or Fatal.
Time to Full. The estimated amount of time until which the disk volume will become full.
Total Space. The total amount of disk space.
Weekly Growth Rate. The average amount of space by which the amount of data stored on the disk volume grows every week.
Table 17. Volumes Performance: Volume

Shows the amount I/O resources used by the virtual machines associated with the disk volume selected in the Volumes Connected To Cluster view.

I/O Distribution. A pie chart indicating how much the individual virtual machines using the selected disk volume contribute to the use of I/O resources.
VM Offenders, Allocated. The amount of disk space allocated to the virtual machine.
VM Offenders, Hyper-V Server. The name of the Hyper-V server on which the virtual machine is running.
VM Offenders, I/O. The data transfer rate utilized by the virtual machine.
VM Offenders, In Use. The amount of disk space the virtual machine currently uses.
VM Offenders, Name. The name of the virtual machine.

Hyper-V Explorer Storage tab (Hyper-V servers)

The Hyper-V Explorer Storage tab displays combination of embedded views displaying disk volumes associated with the selected Hyper-V server. It identifies the virtual machines that spend the highest amounts of disk resources. Use this tab to find out more about the overall consumption of disk resources for a given Hyper-V server. The information provided on this tab can help you prevent potential bottlenecks by reallocating disk resources where they are most needed.

This tab appears in the Hyper-V Explorer when you select a Hyper-V server on the Hyper-V Explorer Topology tab.
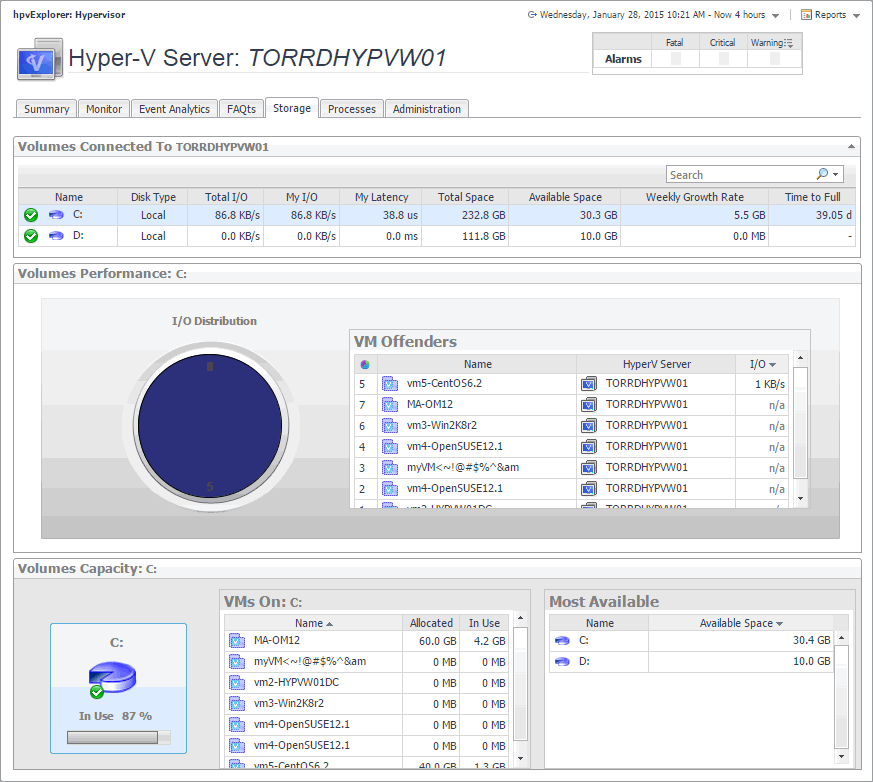
Figure 47. Storage tab (Hyper-V servers)

This tab is made up of the following embedded views:

Table 18. Volumes Connected To Hyper-V Server

Lists the disk volumes connected to the selected Hyper-V server and shows performance metrics associated with each volume.

Available Space. The amount of space available on the disk volume.
Disk Type. Indicates the disk type, for example, Local.
My I/O. The data transfer rate utilized on the disk volume by the selected Hyper-V server.
My Latency. The current latency of requests initiated by the Hyper-V server on the disk volume.
Name. The name of the disk volume. The indicator on the left shows the disk volume’s alarm state: Normal, Warning, Critical, or Fatal.
Time to Full. The estimated amount of time until which the disk volume will become full.
Total I/O. The data transfer rate utilized on the disk volume.
Total Space. The total amount of disk space.
Weekly Growth Rate. The average amount of space by which the amount of data stored on the disk volume grows every week.
Table 19. Volumes Performance: Volume

Shows the amount I/O resources used by the virtual machines associated with the disk volume selected in the Volumes Connected To Hyper-V Server view.

VM Offenders, Hyper-V Server. The name of the Hyper-V server on which the virtual machine is running.
VM Offenders, I/O. The data transfer rate utilized by the virtual machine.
VM Offenders, Name. The name of the virtual machine.
Table 20. Volumes Capacity: Volume

Shows the amount I/O resources used by the virtual machines associated with the selected disk volume.

Disk volume, In Use. The percentage of disk space in use.
Most Available, Available Space. The amount of space available on the disk volume.
Most Available, Name. The disk volume.
VMs On disk volume, Allocated. The amount of memory allocated to the virtual machine.
VMs On disk volume, In Use. The amount of memory used by the virtual machine.
VMs On disk volume, Name. The name of the virtual machine associated with the disk volume.

Hyper-V Explorer Storage tab (virtual machines)

The Hyper-V Explorer Storage tab displays combination of embedded views displaying disk volumes associated with a selected virtual machine. It identifies the virtual machines that spend the highest amounts of disk resources. Use this tab to find out more about the overall consumption of disk resources for a given virtual machine. The information provided on this tab can help you prevent potential bottlenecks by reallocating disk resources where they are most needed.

This tab appears in the Hyper-V Explorer when you select a virtual machine on the Hyper-V Explorer Topology tab.
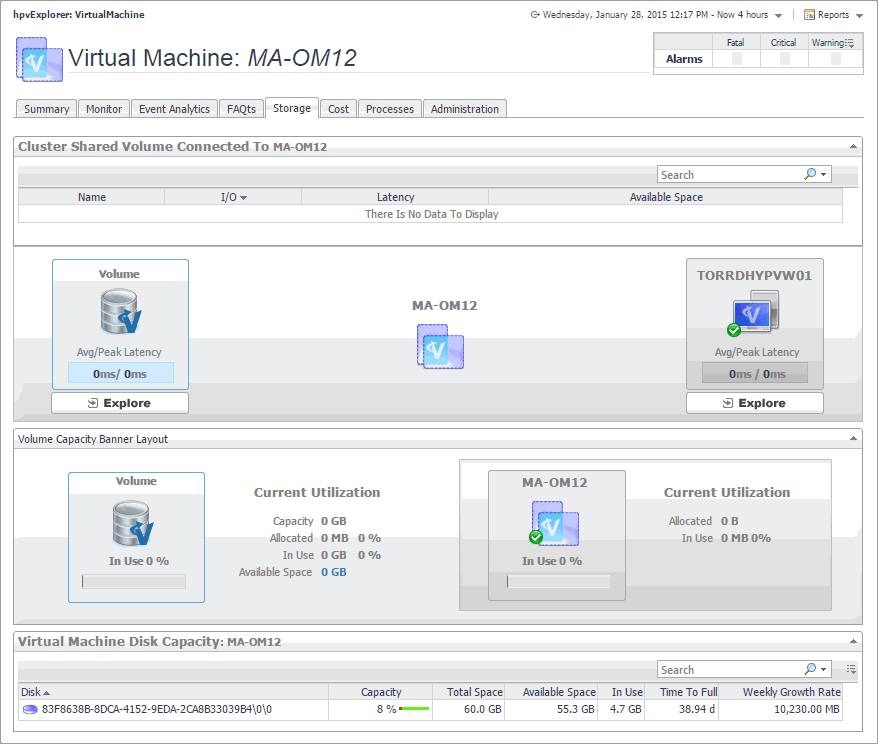
Figure 48. Storage tab (virtual machines)

This tab is made up of the following embedded views:

Lists the disk volumes associated with the selected virtual machine and shows performance metrics associated with each disk volumes.

Available Space. The amount of space available on the disk volume.
I/O. The data transfer rate of the disk volume.
Latency. The disk volume latency.
Name. The disk volume.
Disk Volume, Avg/Peak Latency. The average and peak latency rates for the selected disk.
Hyper-V Server, Avg/Peak Latency. The average and peak latency rates for the Hyper-V server associated with the selected virtual machine.

Contains information about the current utilization of disk resources for the selected virtual machine.

Virtual Machine, Current Utilization, Allocated. The amount and percentage of disk space allocated to the virtual machine.
Virtual Machine, Current Utilization, In Use. The amount and percentage of disk space the virtual machine uses.
Virtual Machine, In Use. The percentage of disk space in use by the virtual machine.
Volume, Current Utilization, Allocated. The amount and percentage of disk space that is allocated for use.
Volume, Current Utilization, Available Space. The disk space available for allocation.
Volume, Current Utilization, Capacity. The total amount of disk space.
Volume, Current Utilization, In Use. The amount and percentage of disk space that is currently in use.
Volume, In Use. The percentage of disk space that is currently in use.
Table 23. Virtual Machine Disk Capacity: Virtual Machine

Lists the disks associated with the selected virtual machine and shows their performance metrics.

Available Space. The space currently available on the disk.
Capacity. The disk capacity.
In Use. The amount of space used on the disk.
Disk. The name of the disk.
Time To Full. The estimated time after which the disk will be full.
Total Space. The total space allocated to the disk.
Weekly Growth Rate. The estimated growth pattern of the used disk space.


Hyper-V Monitoring in Foglight Evolve Cloud alarms

Hyper-V Monitoring in Foglight Evolve Cloud triggers alarms when certain thresholds are reached. You can review the existing alarms on the Hyper-V Alarms dashboard.


관련 문서

The document was helpful.

평가 결과 선택

I easily found the information I needed.

평가 결과 선택