지금 지원 담당자와 채팅
지원 담당자와 채팅

Foglight for Hyper-V 6.0.0 - User Guide

About Hyper-V Monitoring in Foglight Evolve Cloud Agent administration Performance monitoring with the Hyper-V Environment dashboard Performance investigation with the Hyper-V Explorer Hyper-V Monitoring in Foglight Evolve Cloud alarms Appendix: Hyper-V Agent error codes

Volume view

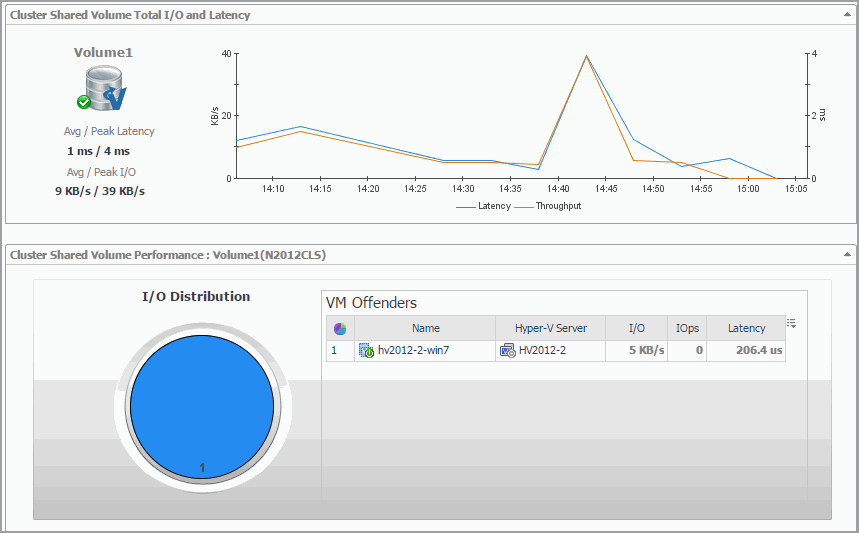
The Volume view shows the data transfer rates and latency detected for the selected volume. It also identifies the virtual machines that use the highest amounts of the volume resources.The information provided on this tab can help you prevent potential bottlenecks by reallocating disk resources where they are most needed.

This view appears in the display area when you click in the Volume Summary view.

Figure 129. Volume view

This view is made up of the following embedded views:

Shows the amount of the volume I/O resources used by the virtual machines associated with the selected volume.

I/O Distribution. A pie chart indicating how much each virtual machine associated with the selected volume contributes to the overall use of I/O resources.
VM Offenders, Hyper-V Server. The name of the Hyper-V server on which the virtual machine is running.
VM Offenders, I/O. The rate at which the virtual machine writes to and reads from the volume.
VM Offenders, IOps. The number of disk read and write operations the virtual machine performed from the beginning of the selected time range.
VM Offenders, Latency. The latency rate detected for the disk read and write operations the virtual machine performed from the beginning of the selected time range.
VM Offenders, Name. The name of the virtual machine.

Drill down on:

VM Offenders, Hyper-V Server. Shows the Hyper-V server details in the Hyper-V Explorer Summary tab.
VM Offenders, Name. Shows the virtual machine details in the Hyper-V Explorer Summary tab.

Displays the data transfer rates and latency detected for the selected volume.

Avg/Peak I/O. The average and peak data transfer rates detected for the selected volume.
Avg/Peak Latency. The average and peak latency rates detected for the selected volume.
Latency. The latency detected for the selected volume over the selected time range.
Throughput. The data transfer rates detected for the selected volume over the selected time range.
Volume. The name of the selected volume and its alarm state.

Virtual switch monitoring

A Hyper-V Virtual Switch is a software-based layer-2 Ethernet network switch. The switch connects virtual machines to virtual and physical networks.

To review data collected about a specific volume or all volumes, make your selection in the Quick-View.

Virtual Switches view

The Virtual Switches tree view lists the available volumes and indicates their severity state.

This view appears in the Quick-View on the left when you select the Virtual Switches tile in the Virtual Environment view.
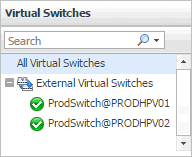
Figure 130. Virtual Switches view

Selecting the All Virtual Switches node displays the overall resource utilization for all virtual switches in your integrated system and identifies the ones that consume the highest amount of network resources in the Summary - All Virtual Switches view on the right. Similarly, selecting a virtual switch node shows switch-specific metrics in the Summary - Virtual Switch view.

Alarm severity. The state of the most recent alarm raised against the virtual switch.
All Volumes. A parent node for the instances of all virtual switches that appear in this view.
Volume. The name of the virtual switch.

Drill down on:

Summary - All Virtual Switches view

The Summary - All Virtual Switches view displays overall resource utilization information for a group of virtual switches and identifies the ones that consume the highest amounts of system resources, potentially causing performance bottlenecks.

This view appears in the Quick-View on the left when you select All Virtual Switches in the Virtual Environment view.
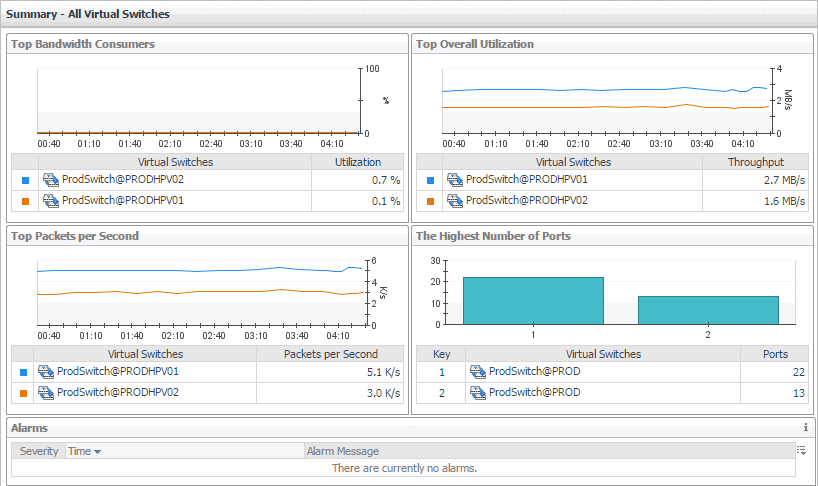
This view is made up of the following embedded views:

Table 81. Alarms

Lists the alarms generated against the monitored virtual switches.

Alarm Message. An explanation about why the alarm occurred.
Severity. Indicates the alarm severity: Warning, Critical, or Fatal.
Time. The time at which the alarm was generated.

Drill down on:

Alarm Message, Severity, or Time. Displays the Alarm dialog box, showing additional information about the alarm. For more information about alarms in Foglight Evolve Cloud, see the Foglight Evolve Cloud User Help.
Figure 132. Alarm dialog box

Identifies the virtual switches with the highest percentage of network utilization.

Top Bandwidth Consumers chart. For each identified virtual switch, the chart displays the percentage of network resources available to it that are in use over the selected time period.
Utilization. The percentage of network resources available to the virtual switch that is currently in use.
Virtual Switches. The name of the virtual switch identified amongst top bandwidth consumers.

Drill down on:

Virtual Switch or Utilization. Shows the virtual switch details in the Summary - Virtual Switch view.

Identifies the virtual switches with the highest numbers of available ports.

Ports. The number of ports available on the virtual switch.
The Highest Number of Ports chart. For each identified virtual switch, the chart displays the number of available ports.
Virtual Switches. The name of the virtual switch.

Drill down on:

Virtual Switch or Ports. Shows the virtual switch details in the Summary - Virtual Switch view.

Identifies the virtual switches with the highest network transfer rates.

Throughput. The current rate of network throughput for the selected virtual switch.
Top Overall Utilization chart. For each identified virtual switch, the chart displays the network throughput rate over the selected time period.
Virtual Switches. The name of the virtual switch identified amongst top network consumers.

Drill down on:

Virtual Switch or Throughput. Shows the virtual switch details in the Summary - Virtual Switch view.

Identifies the virtual switches with the highest data packet traffic.

Packets per Second. The average rate of the data packets that are sent to the virtual switch.
Top Packets per Second chart. Identifies the virtual switches with the highest rates of data packet traffic over the selected time period.
Virtual Switches. The name of the virtual switch identified as having a high rate of data packet traffic.

Drill down on:

Virtual Switch or Packets per Second. Shows the virtual switch details in the Summary - Virtual Switch view.
관련 문서

The document was helpful.

평가 결과 선택

I easily found the information I needed.

평가 결과 선택