지금 지원 담당자와 채팅
지원 담당자와 채팅

Foglight for DB2 (Cartridge) 5.9.4.20 - User Guide

Introduction to Foglight for DB2 LUW Using Foglight for DB2 LUW Reference
Dashboards and Views Collections and Metrics
CF Locks Collection CF Memory Pools Collection CF Resource Usage Collection Current Agents Details Collection Agents Summary Collection Current Locks Wait Collection Database Bufferpools Summary PS Collection Database Configuration Collection Database Tablespaces Collection Database Tablespaces Summary Collection Database Usability Collection Database Parameters Collection Database Instance Parameters Collection Database Instance Registry Variables Collection Database Tablespaces BP Collection FCM Activity Collection FS DB Storage Collection FS DB Storage Summary Collection FS Instance Storage Collection FS Storage Collection FS Storage Summary Collection General Activity Collection HADR Activity Collection Host Properties Collection OS General Collection Instance Activity Collection Instance General Collection Instance Nodes Collection Instance Usability Collection IO Activity Collection License Details Collection Log Activity Collection Log File Collection Log Message Collection Messages Count Collection Monitor Switches Collection OS DB2 General Process Collection Partition Tablespaces Summary Collection Partition Usability Collection pureScale Alerts Collection Top SQLs Collection Query Agents Details Collection Database Partition Activity Collection DB2 Partition Subcategories Wait Collection History Locks Wait Collection History Locks Summary Collection Instance Memory Collection Instance Memory Pool Collection Instance Memory Summary Collection Instance Memory Total Collection Database Memory Collection Database Memory Pool Collection Database Memory Pool DB Collection Database Memory Summary Collection Database Memory Total Collection Database Buffer Pools Collection Database Tables Collection Database Partition Backup Collection Database Tables Global Collection Database Applications Collection

Instance Homepage

The DB2 Database Instance Homepage displays a summary view of the instance health. You drill down further to carry out root cause analysis of various performance issues.

To access the Instance Homepage, drill down to Databases Dashboard > Instance Homepage .

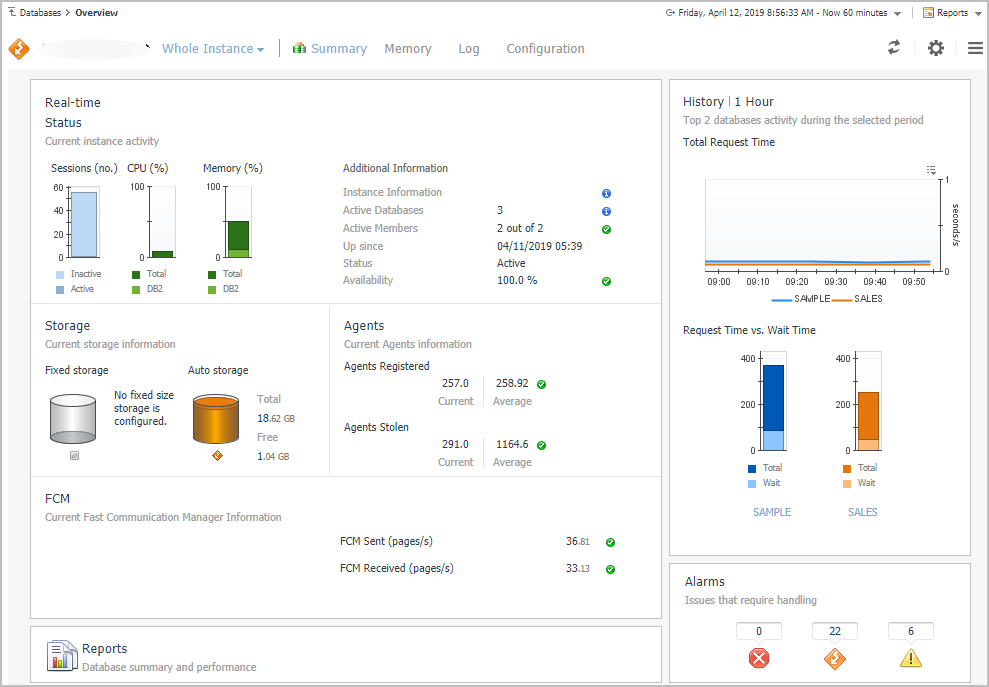
For more information, see Instance home page.

Database Homepage

The Database Homepage provides an overall view of the status of the selected entity for the selected time range, as well as drill-downs, which provide a visual representation of the status and performance of the monitored DB2 environment. These drill-downs allow you to determine any potential bottlenecks in database performance.

To access the Database Homepage, navigate through Databases Dashboard > Instance Homepage > Select Database, and then select a database name.

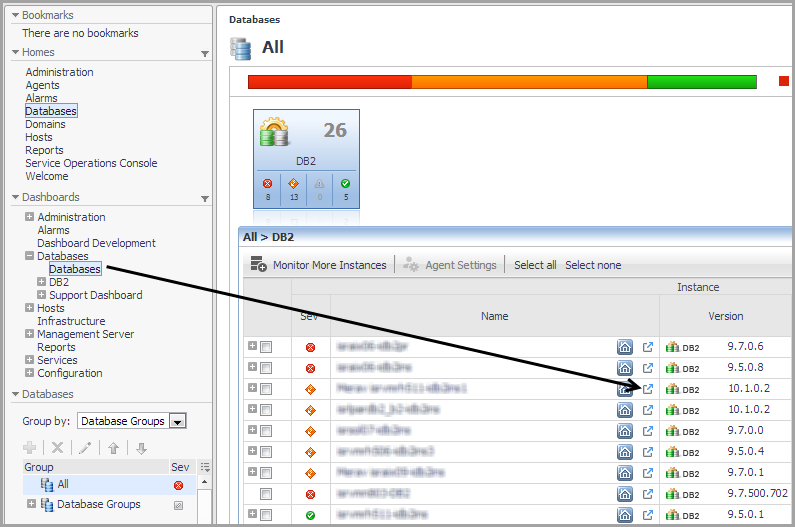
You can also access the Database Homepage for a database from the Databases Dashboard by clicking the icon at the far right of the database name cell and then selecting Database Homepage from the menu that appears.

For information about the various sections appearing on this Homepage, see Database home page .

Using the Database Homepage Toolbar

The Database Homepage toolbar allows you to drill down and view a variety of DB2 database metrics.

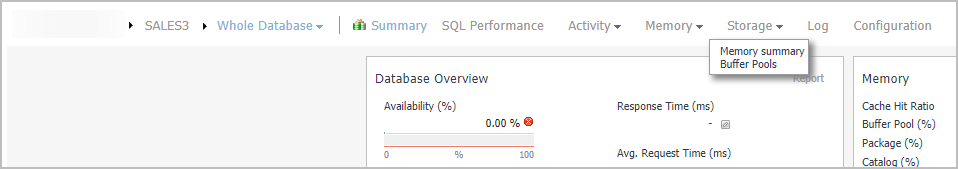
The following toolbar options are provided:

Summary — goes back, from any of the drill-downs, to the Database homepage.
SQL Performance — provides the ability to investigate the activity and resource consumption of a selected database or database partition. For more information on this dashboard, see SQL Performance .
Activity — allows you to explore SQL metrics using the following panels:
Memory — allows you to explore database memory using the following panels:
Storage — allows you to explore DB2 storage using the following panels:
Log — allows you to explore the Diagnostic Log Panel.
Configuration — allows you to explore the Initialization Parameters Panel.

Activity Panel

Use the Top Tables panel to help you monitor the performance of database tables.

To access the Top Tables panel, navigate through Databases Dashboard > Instance Homepage > Database Homepage, and then choose Activity > Top Tables.

For more information about this panel, see Top Tables .

The Locks panel displays information about current locks and historical locks held in the selected database.

To access the Locks panel, navigate through Databases Dashboard > Instance Homepage > Database Homepage, and then choose Activity > Locks.

You can also access the Locks panel for a database from the Databases Dashboard by clicking the icon at the far right of the database name cell and then selecting Locks from the menu that appears.

For more information, see Locks.

This panel provides metrics on agent workload, activity, and background operations.

To access the Current Agents panel, navigate through Databases Dashboard > Instance Homepage > Database Homepage, and then choose Activity > Current Agents.

You can also access the Current Agents panel for a database from the Databases Dashboard by clicking the icon at the far right of the database name cell and then selecting Current Agents from the menu that appears.

For more information, see Current Agents.

The User-defined Collections panel allows viewing the customized collections, which were created via the User-defined Collections page in the Administration dashboard, either during the last sample (Last Snapshot) or plotted over the specified time range (Selected Period).

To access the User-defined Collections panel, navigate through Databases > Instance Homepage > Database Homepage, and then choose Activity > User-defined Collections.

For more information, see User-defined Collections.

관련 문서

The document was helpful.

평가 결과 선택

I easily found the information I needed.

평가 결과 선택