
Using Foglight Capacity Director
Installation requirements
Performance Agent Configuration for Foglight Capacity Director
Hyper-V Agent Configuration for Foglight Capacity Director
Dashboard location and UI elements
Getting Started Tab
Current Capacity Tab
Resource Utilization Tab
Scenario Modeler Tab
Server Purchase Tab
Report Tab
Performance Tuning Tab
Changes and DRS Rules Tab
Adding a Planned Change
Infrastructure Organizations Tab
Modeling a Cluster Addition
Modeling a Host Addition
Adding Virtual Machines
Modeling a Host Decommission
Decommissioning Virtual Machines
Modeling a Host Movement
Moving Virtual Machines
Adding a Datastore (Preview)
Modeling a Datastore Decommission (Preview)
Modeling a Datastore Expansion (Preview)
Modeling a Datastore Shrink (Preview)
Editing a Planned Change
Deleting a Planned Change
Clusters/Hosts and Workload pane
The Clusters tab and the Hosts and Workload tab display the details related to the selected virtual center or datacenter. This information is automatically updated after selecting a cluster and when including/applying planned changes.
The Clusters tab includes the following data:
|
• |
Select a Cluster: Lists available clusters in the selected virtual center or datacenter. |
|
• |
Current Capacity: Displays the current capacity of the selected cluster, which includes the following data: CPU, Memory, Storage, Hypervisors, and VMs and Templates. These values are not affected by including/excluding planned changes on the Planned Changes pane. |
|
• |
Peak CPU Performance: Displays the current CPU data of the selected cluster, which includes the following data: vCPU/Core Ratio, Physical CPU Cores, Powered On vCPUs, and Average % Ready. These values are not affected by including/excluding planned changes. |
|
• |
Recommendations: Displays recommendations on the resources (CPU, Memory, and Storage) to be added in the future to ensure that the resource utilization is balanced. Use the Settings dialog box to edit the Baseline for Forecasting. For more information, see . These values are automatically updated when including/applying planned changes. |
|
• |
Resource utilization related views: Projected CPU Usage view, Projected Memory Usage view, Projected Storage Usage view, and Projected Storage IOPs Usage view. The metric line in the white area is the history data, while the metric line in the gray area is the predicted data. These views are refreshed automatically after including planned changes. The following is an example of the Projected Memory Usage view. For more information, see Resource Utilization related views. |
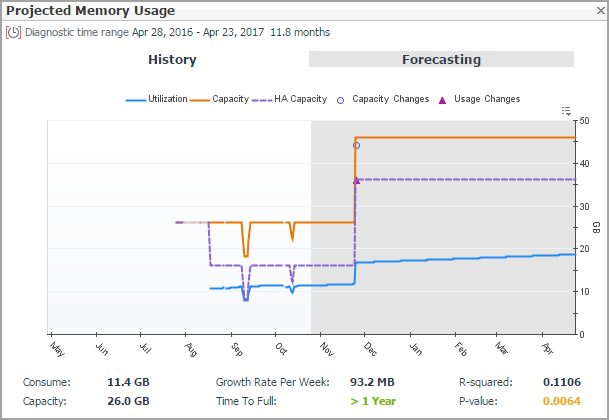
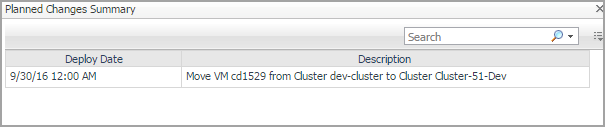
Click  or
or  on the Projected Memory Usage view to display the Planned Changes Summary dialog box that summarizes the planned changes.
The Hosts and Workload tab includes the following data:
|
• |
Select a Cluster: Lists available clusters in the selected virtual center or datacenter. |
|
• |
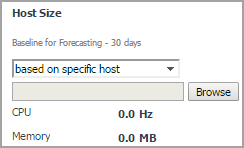
Overview: Summarizes the CPU capacity and memory capacity of the selected cluster. Both capacities are calculated based on the value selected from the Host Size drop-down list. The Host Size drop-down list includes the following options: average host size (default value) and based on specific host. The Host Requirement - Average Host Size view is refreshed automatically after changing the Host Size value. For more information, see Calculating Host Size based on specific host. |
The value of Baseline for Forecasting on the display area can be edited using the Settings dialog box. For more information, see Settings Menu.
|
• |
Recommendation on Additional Servers: Displays how many new servers should be added in the future (namely the value of Time Frame). This value is calculated based on the selected planned changes and the projected resource usage. Use the Settings dialog box to edit Time Frame. For more information, see . |
|
NOTE: The new servers need to be added in the Server Purchase tab. Click >>Link to Server Purchase to add a new server. For more information, see Server Purchase Tab. |
|
• |
Host Requirement - Average Host Size: Displays the number of Required Hosts and Available Hosts, if the existing server is used as the calculation benchmark. |
|
• |
Required Hosts: Shows with the blue line, indicating how many hosts are required to support the current number of virtual machines. This number is populated based on the value selected from the Host Size drop-down list. |
|
• |
Available Hosts: Shows with the amber line, indicating the number of hosts, available in the selected cluster. |
|
• |
Host Requirement - <New Servers>: Displays the number of Required Hosts and Available Hosts, if the new server is used as the calculation benchmark. |
|
• |
Required Hosts: Indicates how many hosts are required to support the usage of virtual machines. This number is populated based on the Server Details. |
|
• |
Available Hosts: Indicates the number of hosts, available in the selected cluster. |
Calculating Host Size based on specific host
Resource Utilization related views
Projected CPU Usage view
Table 1. Projected CPU Usage view
|
This view displays CPU utilization metrics on the selected cluster. | |||||||||
|