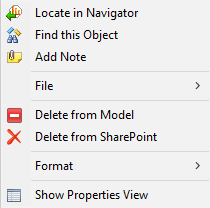
This area will display Content Types, Columns and Lists that are enabled for viewing.
You may select and drag one or more content types, columns and lists inside the diagram. If you select an individual object, its properties will be displayed in the Property tab in the Properties and Information area (4) of the interface.
Object specific menus can be accessed by right-clicking a specific object (or from the Diagram Menu and Diagram Menu Bar at the top of the page).
An overview of the commonly used features from these menus is provided below.
|
Menu Option |
Description |
|
|
Selecting this option will identify and highlight the corresponding object in the Navigator Pane. |
|
|
Selecting this option will find all instances of the object and provide the search results in the Properties portion of the screen, in a newly opened "search" tab. |
|
|
Selecting this option allows the user to document information about the selected object. |
|
|
Selecting this option can save the selected object(s) to an image file (e.g... jpg, gif, etc) or send to a printer. |
|
|
Selecting his option will remove the object from the diagram. |
|
|
Selecting this option will remove the object from SharePoint. |
|
|
Selecting this option will allow you to format the look of the object within the diagram. |
|
|
The Arrange option is available either from the main menu or the Format sub-menu. It can be particularly useful to auto organize the entire diagram or a set of objects. |
|
|
Selecting this option will open up the Properties view for the selected object within the Properties portion of the screen. |
The Palette area is broken up into three sections. The top level contains some handy tools to magnify and document the diagrams. The middle section will let you create content types, lists and column groups inside the diagram and the bottom section contains column types that can be created inside these objects.
In order to create one of these objects, click on it inside the palette and then click again in the area of the diagram where you want to object to be placed. The following table reviews the specific Palette objects available to the user. These may change based on custom columns available to the user.
|
Symbol |
Description |
|
|
The magnifying option will zoom in and out sections of the diagram. A drop down zooming option is also available in the menu bar. |
|
|
The Note menu has three options. ·Note allows you to attach a sticky note to the diagram. ·Text will create a text box that can be used for the title in the diagram. ·Note Attachment is associated with a specific object and is intended to document information about that object. In order to create a Note Attachment, click on it inside the palette, then click (and hold) on the object in the diagram that will be associated with the note and then drag the mouse to the area where the note will be located. |
|
|
The Entities section has four available options, but not all may be visible. For example, if Lists are hidden (see Object Container Menu) then the List entity will not be available. ·Type will create a new content type in the diagram. After creating the content type, navigate to the Properties Tab in the Properties and Information area to change specific properties. ·Inheritance will create an association between a content type and a single other content type. The associations enforce all SharePoint rules so a content type may only be associated with a single parent. To create an inheritance, you must click on this item in the Palette, then first click on the child content type and then its parent. ·List will create a new list in the diagram. See the Creating Lists/Libraries in the Common Functions section of this document. ·Group will create a column group container in the diagram. |
|
|
The columns section includes a variety of columns that may be added to any column group or content type. Note that a column that is added directly into a content type is by default placed in the Custom Column Groups. Columns with duplicate names cannot be created. To learn more about creating columns see the Creating Columns section in the Common Functions sections of this document. |
The Outline provides a thumbnail image of the current diagram.
The semi-transparent blue box represents the current visible area inside the Diagram pane. You may use your mouse to drag this box to quickly navigate to other parts of the diagram.
This pane contains several spreadsheets like tabs that provide information and allow the user to manipulate objects inside the diagram and SharePoint environment.